Market Outlook
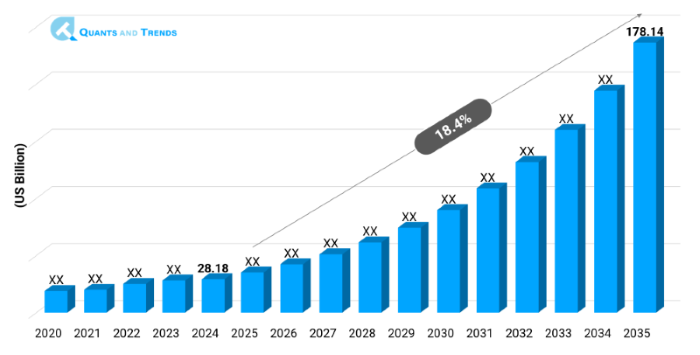
The global patient engagement and experience market was valued at approximately USD 28.18 billion in 2024 and is projected to grow at a compound annual growth rate (CAGR) of 18.4% from 2025 to 2035, reaching around USD 178.14 billion by the end of the forecast period. The historical analysis starts from 2020 to 2023 with 2024 as the base year and forecasts starts from 2025 to 2035.
The Patient Engagement and Experience Market is witnessing a fundamental shift mobile health adoption, AI-enhanced personalization, and regulatory incentives like value-based care mandates. The market forecast remains overwhelmingly positive. North America has been dominating and APAC is the fastest-growing region that is enabled by investments in digital infrastructure and an increase in the prevalence of chronic diseases.
| Base Year | 2024 |
|---|---|
| Forecast Period | 2025-2035 |
| Historical Period | 2020-2023 |
| CAGR | 18.4% |
| Market Value In 2024 | USD 28.18 billion |
| Market Value In 2035 | USD 178.14 billion |
Introduction
The Patient Engagement and Experience Market Report explores the changing terrain of innovations that equip patients with greater agency while simultaneously refining the processes of clinical care. The field comprises online platforms, smartphone applications, patient portals, and remote monitoring technologies all aimed at enhancing dialogue, satisfaction, and adherence to treatment regimens. As healthcare organizations face increasing demands to elevate clinical outcomes and lower readmission rates, the Patient Engagement and Experience Industry Analysis illustrates the ways that cohesive technologies are reshaping the interaction between patients and providers. The document further evaluates the Patient Engagement and Experience Competitive Landscape, identifying established companies and emerging startups dedicated to delivering novel, user-centered solutions. By presenting an integrated overview of market expansion accelerators, segment dynamics, and potential obstacles, this analysis serves as an essential instrument for decision-makers pursuing informed, strategic direction.
Key Market Drivers: What’s Fueling the Patient engagement and experience Market Boom?
- Digital Health and Telemedicine Boom: The Patient Engagement and Experience Growth Drivers & Challenges are closely tied to the expedited use of telemedicine and online care delivery systems. With patients adopting the remote consultations, engagement tools, like secure messaging, virtual waiting rooms, and post-visit following up, have gained criticality. The integration both improves patient experience and, at the same time, helps providers scale the services and avoid non-urgent visits efficiently. The satisfaction and adherence are, thus, raised by the convenience and continuous care models offered.
- Shift Toward Value‑Based Care: A shift towards value based care has placed patient experience as a realizable quality metric in terms of expense, reasonable and outlandish. These providers receive incentives to produce quantifiable engagements, satisfaction, and outcomes. This trend increases the pace of investing in solutions, which facilitate real-time feedback, surveys of satisfaction, and outcomes. These digital engagement platforms show readmission reduction and HCAHPS score improvement benefits, which generates future investment.
- Regulatory and Policy Focus: Governmental regulation and payer policy take on a greater focus on transparency, and patient empowerment. ONC rules on interoperability (US) and GDPR-like mandates on patient rights (EU) necessitate providers to provide record access as well as access to communication portals. This Regulatory & Policy Overview pressures healthcare companies to implement effective engagement technologies to pass compliance, adoption, and increase engagement trust.
Note: Charts and figures are illustrative only. Contact us for verified market data.
Innovation in Focus: How Manufacturers Are Raising the Bar?
The Patient Engagement and Experience Market Report are focusing on innovations with the help of AI-based chatbots, predictive analysis, and gamification strategies. Chatbots and AI assistants help optimize the process of booking appointments and sorting complaints, and analytics tools can predict the requirements of patients, thereby creating opportunities to reach out to them proactively. Gamified uses grant rewards to compliance and self-management notably in chronic disease management. New mobile-first portal patients add wearable information and telehealth modules to single portals. Such developments are providing new levels of benchmark engagement efficacy by providing intuitive, interactive, and personalized care journeys that resonate well with your changing consumer demands.
Recent Developments:
- In May 2025, Salesforce Health Cloud introduced AI‑driven care reminders and predictive engagement modules to focus on chronic illnesses management, which was further supported by Patient Engagement and Experience Market Investment Opportunities.
- In June 2025, Epic Systems unveiled its MyChart Advanced, its mobile-first solution, where live telehealth is provided by integrated wearables and feedback loops in real-time based on the Key Trends in Patient Engagement and Experience.
Conclusion
In conclusion, the Patient Engagement and Experience Market Report highlights that the involved landscape is dynamic landscape driven by digital transformation, regulatory requirements, and consumer expectation of connected care. The market is growing due to a strong demand to adopt cloud-based platforms and mobile applications, and North America is the largest, and the APAC market sees the most growth. Value-based care models are going mainstream, and the innovation powered by AI tools is emerging as players in the market are reshaping themselves via collaborations and platform consolidations. The competitive advantage will be characterized by strategic investments in interoperability, individually focused engagement, and real time analytics. These trends and regional dynamics should be utilized by the stakeholders in order to benefit of the emerging opportunities in patient-centric healthcare delivery.
Related Reports
- The global Hospital and Clinical Design Market was valued at approximately USD 570 Million in 2024 and is projected to grow at a compound annual growth rate (CAGR) of 8.4% from 2025 to 2035, reaching around USD 1,379.6 Million by the end of the forecast period.
- The global Telemedicine Market was valued at approximately USD 138.42 billion in 2024 and is projected to grow at a strong compound annual growth rate (CAGR) of 16.8% from 2025 to 2035, reaching over USD 685.23 billion by the end of the forecast period.
Key Market Players
Patient Engagement and Experience Competitive Landscape is characterized by a combination of established vendors of EHRs with nimble technology companies. In portal integration, the major EHR players are predominant, and mid-size innovators concentrate on niche mobile applications and AI-based tools. The collaboration between healthcare systems, payers, and startups is typical for developing tailor-made solutions. Consolidation is underway through the wish of vendors to provide end-to-end engagement platforms. Interoperability and the user-friendly design are transforming positioning and go-to-market strategies throughout the industry. Some of the key players in the Patient engagement and experience industry are as:
Cerner (Oracle Health), Epic Systems, Allscripts, Athenahealth, Meditech, Philips Healthcare, Siemens Healthineers, IBM Watson Health, Salesforce Health Cloud, Teladoc Health, MyChart (by Epic), GetWellNetwork, Grand Rounds, Welltok (HEALOW)
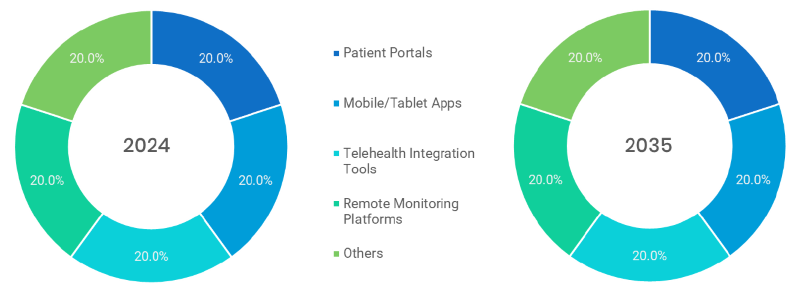
- Patient Portals (Dominating): Dominated tools that offer more secure access to medical records, scheduling appointments, direct messaging providers, and lab results that makes a patient transparent, and keeps an active role in all the operations of their healthcare.
- Mobile/Tablet Apps (Fastest-Growing): These apps are increasingly used because of the penetration of smartphones; it has an ability to track health in real time, reminders on medication, teleconsultation, and access records, and it meets consumer demands in engaging in healthcare on the move.
- Telehealth Integration Tools: They include video consultation platforms, virtual waiting rooms, and the synchronization of EHRs, allowing diagnosing and treating people remotely, which is applicable to post-pandemic digital health plans.
- Remote Monitoring Platforms: They can apply to chronic disease care, through the collection of biometrics data, such as heart rate or glucose, which is then shared with providers in real time; this allows proactive and personalized treatments with providers.
- Others: This segment is a key indicator of market evolution such as chatbots and virtual assistants that give personalized help and automate routine questions. It also has patient education platforms that give personalized health information and digital intake solutions that make filling out forms before an appointment easier.
Note: Charts and figures are illustrative only. Contact us for verified market data.
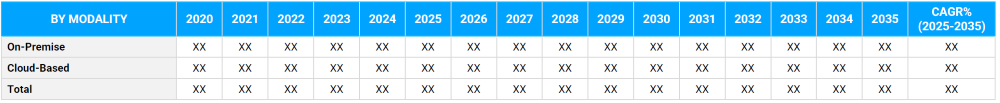
- On-Premise (Dominant): It is implemented on the hospital infrastructure and the data and the systems are controlled directly. They are mainly preferred by institutions with great IT resources and high rates of data security or compliance.
- Cloud based (Fastest-Growing): This is fast growing as it is flexible, cost effective and EHR friendly. They integrate the multi-instance access and enablement especially in health care settings that are more distributed or smaller.
Note: Charts and figures are illustrative only. Contact us for verified market data.
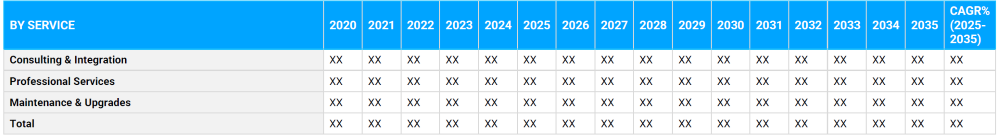
- Consulting & Integration (Dominant): Its main characteristics are legacy system research, desktop planning, and workflow customization in order to make operations more efficient and engage patients in different care facilities.
- Professional Services (Fastest-Growing): In regard to implementation services, user training and support is also provided to ensure there is good adoption of the system and therefore good utilization of the systems by the clinical staffs and the patients.
- Maintenance & Upgrades: Offers continuing upgrades, security fixes and performance enhancements in order to ensure long-term effectiveness of the platform, compliance and dynamism to emerging health IT environment.
Note: Charts and figures are illustrative only. Contact us for verified market data.
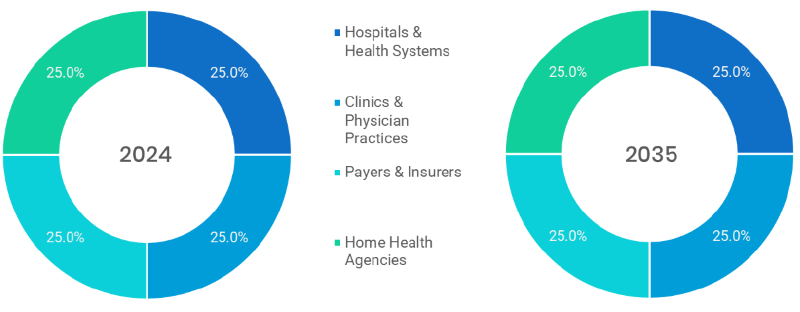
- Hospitals & Health Systems (Dominant): Patient engagement tools have been invested in heavily by hospitals and health systems to achieve enterprise-wide data access, enhance care coordination, and regulatory compliance to quality care delivery.
- Clinics & Physician Practices (Fastest-Growing): Fast pioneers of light, scalable solutions that support patient contact, appointment facilitation and access to EHRs without significant up-front expenditure.
- Payers & Insurers: Use portals to enroll members in wellness programs, preventive care programs and policy management with the purpose to lower claims and increase member satisfaction.
- Home Health Agencies: The rising use of remote strategies to check the condition of patients not receiving care in clinical facilities allows providing them with continuity of care and action at the point when it is needed.
Note: Charts and figures are illustrative only. Contact us for verified market data.
Segmentation By Region
Where the Market is Growing Fastest?
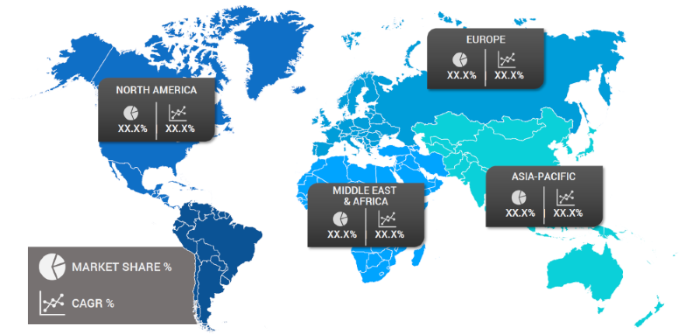
In regional terms, North America leads the Patient Engagement and Experience Market as the region has mature healthcare infrastructure, regulatory requirements, such as ONC Cures Act, and heavy investments in digitalization in the region. But, the most dynamic region is APAC that soars on increases in smartphone penetration as well as government digitalization programs and an expansion to the middle-class population that embraces quality care. Europeans come next with good rates of growth in the national health systems and a regulatory base in place. Altogether, North America is still the biggest market, whereas APAC is the fastest one to grow.
The following countries and regions will be covered in the report:
• North America: U.S., Canada and Mexico
• Asia Pacific: China, India, Japan, South Korea, Australia, among others
• Europe: Germany, France, Italy, Spain, UK, Russia, Rest of Europe
• Latin America: Brazil, Argentina, Colombia
• Middle East & Africa: Saudi Arabia, UAE, South Africa, Israel, Turkey
Note: Charts and figures are illustrative only. Contact us for verified market data.
1. Patient Engagement and Experience Market: Market Introduction & Context
1.1. Market Definition
1.2. Scope of the Study
1.3. Research Methodology
1.3.1. Primary Data Collection
1.3.2. Secondary Data Sourcing
1.3.3. External Industry Collaborations
1.3.4. In-House Research Databases
1.3.5. Analytical Frameworks & Forecasting End-Users
1.3.6. Data Validation and Final Report Publishing
1.4. Key Assumptions
1.5. Market Ecosystem Overview
1.6. Stakeholder Analysis (Manufacturers, Suppliers, Growers, Distributors, Retailers)
(introduces the report’s scope, methodology, and assumptions to help the client clearly understand the study's coverage, data sources, and reliability)
2. Patient Engagement and Experience Market: Executive Summary
2.1. Key Insights & Market Snapshots
2.2. Analyst Viewpoint
2.3. Market Attractiveness Index
(offers a brief yet insightful market summary, giving the client a quick grasp of key trends, market potential, and strategic highlights)
3. Patient Engagement and Experience Market: Market Dynamics & Outlook
3.1. Drivers and their impact analysis
3.2. Restraints and their impact analysis
3.3. Opportunities and their impact analysis (Emerging Markets, New Product Categories)
3.4. Patent & Innovation Analysis (2020–2024)
(explains the major drivers, restraints, opportunities, and challenges shaping the market, enabling the client to assess both growth prospects and potential risks)
4. Patient Engagement and Experience Market: Market Environment & Industry
4.1. PESTEL Analysis
4.1.1. Political
4.1.2. Economic
4.1.3. Social
4.1.4. Technological
4.1.5. Environmental
4.1.6. Legal
4.2. Porter’s Five Forces Analysis
4.2.1. Threat of New Entrants
4.2.2. Bargaining Power of Buyers
4.2.3. Bargaining Power of Suppliers
4.2.4. Substitution Risk
4.2.5. Competitive Rivalry
4.3. Pricing Trend Analysis by Region (2024–2030)
4.4. Value Chain & Supply Chain Analysis
4.5. Impact of Digitalization
4.6. Service & Innovation Landscape
4.7. Regulatory Framework Analysis
4.7.1. Global & Regional Regulations
4.7.1.1. North America
4.7.1.2. Europe
4.7.1.3. APAC
4.7.1.4. LATAM
4.7.1.5. MEA
4.8. Import/Export Restrictions & Tariff Impact
4.9. Government Initiatives
4.10. Impact of Escalating Geopolitical Tensions
(provides an overview of the industry landscape, covering market dynamics, technological advancements, pricing trends, and regulatory influences for informed decision-making)
5. Patient Engagement and Experience Market– By Product Type
5.1. Overview
5.1.1. Segment Share Analysis, By Product Type, 2024 & 2035 (%)
5.1.2. Patient Portals
5.1.3. Mobile/Tablet Apps
5.1.4. Telehealth Integration Tools
5.1.5. Remote Monitoring Platforms
5.1.6. Others
(presents market segmentation by Product Type, guiding the client on the product categories that are expected to drive demand and shape future revenue streams)
6. Patient Engagement and Experience Market– By Modality
6.1. Overview
6.1.1. Segment Share Analysis, By Modality, 2024 & 2035 (%)
6.1.2. On-Premise
6.1.3. Cloud based
(breaks down the market by Modality, assisting the client in identifying material or origin preferences and emerging growth segments)
7. Patient Engagement and Experience Market– By Service
7.1. Overview
7.1.1. Segment Share Analysis, By Service, 2024 & 2035 (%)
7.1.2. Consulting & Integration
7.1.3. Professional Services
7.1.4. Maintenance & Upgrades
(focuses on market segmentation by Service, helping the client prioritize specific crop Product Types or end-use areas that offer significant business opportunities)
8. Patient Engagement and Experience Market– By End-User
8.1. Overview
8.1.1. Segment Share Analysis, By End-User, 2024 & 2035 (%)
8.1.2. Hospitals & Health Systems
8.1.3. Clinics & Physician Practices
8.1.4. Payers & Insurers
8.1.5. Home Health Agencies
(describes the market division by End-User of Service, enabling the client to understand which usage methods are preferred and where future demand may rise)
9. Patient Engagement and Experience Market– By Geography
9.1. Introduction
9.1.1. Segment Share Analysis, By Geography, 2024 & 2035 (%)
9.2. North America
9.2.1. Regional Overview & Trends
9.2.2. Patient Engagement and Experience Key Manufacturers in North America
9.2.3. North America Market Size and Forecast, By Country, 2024 - 2035 (US$ Million)
9.2.4. North America Market Size and Forecast, By Product Type, 2024 - 2035 (US$ Million)
9.2.5. North America Market Size and Forecast, By Modality, 2024 - 2035 (US$ Million)
9.2.6. North America Market Size and Forecast, By Service, 2024 - 2035 (US$ Million)
9.2.7. North America Market Size and Forecast, By End-User, 2024 - 2035 (US$ Million)
9.2.8. U.S.
9.2.8.1. Overview
9.2.8.2. U.S. Market Size and Forecast, By Product Type, 2024 - 2035 (US$ Million)
9.2.8.3. U.S. Market Size and Forecast, By Modality, 2024 - 2035 (US$ Million)
9.2.8.4. U.S. Market Size and Forecast, By Service, 2024 - 2035 (US$ Million)
9.2.8.5. U.S. Market Size and Forecast, By End-User, 2024 - 2035 (US$ Million)
9.2.9. Canada
9.2.9.1. Overview
9.2.9.2. Canada Market Size and Forecast, By Product Type, 2024 - 2035 (US$ Million)
9.2.9.3. Canada Market Size and Forecast, By Modality, 2024 - 2035 (US$ Million)
9.2.9.4. Canada Market Size and Forecast, By Service, 2024 - 2035 (US$ Million)
9.2.9.5. Canada Market Size and Forecast, By End-User, 2024 - 2035 (US$ Million)
9.2.10. Mexico
9.2.10.1. Overview
9.2.10.2. Mexico Market Size and Forecast, By Product Type, 2024 - 2035 (US$ Million)
9.2.10.3. Mexico Market Size and Forecast, By Modality, 2024 - 2035 (US$ Million)
9.2.10.4. Mexico Market Size and Forecast, By Service, 2024 - 2035 (US$ Million)
9.2.10.5. Mexico Market Size and Forecast, By End-User, 2024 - 2035 (US$ Million)
Note: Similar information and analysis will be provided for all other regions (Europe, APAC, LATAM and MEA) and countries listed in the subsequent sections.
9.3. Europe
9.3.1. Germany
9.3.2. Italy
9.3.3. United Kingdom
9.3.4. France
9.3.5. Russia
9.3.6. Poland
9.3.7. Rest of Europe
9.4. Asia Pacific (APAC)
9.4.1. India
9.4.2. China
9.4.3. Japan
9.4.4. South Korea
9.4.5. Australia
9.4.6. Rest of APAC
9.5. Latin America
9.5.1. Brazil
9.5.2. Argentina
9.5.3. Colombia
9.5.4. Rest of LATAM
9.6. Middle East and Africa
9.6.1. Israel
9.6.2. Turkey
9.6.3. Egypt
9.6.4. Rest of MEA
(delivers a detailed regional and country-level analysis, supporting the client in recognizing growth hotspots and strategically allocating resources across geographies)
10. Patient Engagement and Experience Market: Competitive Landscape & Company Profiles
10.1. Market Share Analysis (2024)
10.2. Company Positioning Matrix (Leaders, Innovators, Emerging Players)
10.3. Company Profiles (Key Players: Overview, Products, Strategies, Financials, Recent Developments)
10.3.1. Cerner (Oracle Health)
10.3.2. Epic Systems
10.3.3. Allscripts
10.3.4. Athenahealth
10.3.5. Meditech
10.3.6. Philips Healthcare
10.3.7. Siemens Healthineers
10.3.8. IBM Watson Health
10.3.9. Salesforce Health Cloud
10.3.10. Oracle Health (Cerner)
10.3.11. MyChart (by Epic)
10.3.12. GetWellNetwork
10.3.13. Grand Rounds
10.3.14. Welltok (HEALOW)
10.3.15. Teladoc Health
10.3.16. Others
Note: All company profiles will include details under the standard heads mentioned in section 10.3 - Overview, Products, Strategies, Financials, and Recent Developments. We also offer customization of the company profiling section based on your specific requirements.
(provides an assessment of key competitors, market shares, and strategic developments, giving the client essential insights to benchmark against or collaborate with industry leaders)
11. Patient Engagement and Experience Market: Future Market Outlook (2025–2035)
11.1.1. Scenario Analysis (Optimistic, Realistic, Pessimistic)
11.1.2. Disruptive Technologies Impact
11.1.3. Emerging Business Trends
11.1.4. Business Opportunities for startups and existing players
(presents market forecasts and future outlook scenarios, preparing the client for upcoming trends, innovations, and potential shifts in market structure)
12. Patient Engagement and Experience Market: Strategic Recommendations
(offers strategic recommendations for various stakeholders, enabling the client to make informed business decisions that maximize growth and minimize risks)
13. Patient Engagement and Experience Market: Disclaimer
(states the report’s disclaimers and legal boundaries, ensuring the client understands the terms of use, limitations, and responsibilities associated with the report)
List of Tables
TABLE 1: List of Data Sources
TABLE 2: Market Drivers; Impact Analysis
TABLE 3: Market Restraints; Impact Analysis
TABLE 4: Patient Engagement and Experience Market: Product Type Snapshot (2024)
TABLE 5: Segment Dashboard; Definition and Scope, by Product Type
TABLE 6: Global Patient Engagement and Experience Market, by Product Type 2022–2035 (USD Million)
TABLE 7: Patient Engagement and Experience Market: Modality Snapshot (2024)
TABLE 8: Segment Dashboard; Definition and Scope, by Modality
TABLE 9: Global Patient Engagement and Experience Market, by Modality 2022–2035 (USD Million)
TABLE 10: Patient Engagement and Experience Market: Service Snapshot (2024)
TABLE 11: Segment Dashboard; Definition and Scope, by Service
TABLE 12: Global Patient Engagement and Experience Market, by Service 2022–2035 (USD Million)
TABLE 13: Patient Engagement and Experience Market: Service Snapshot (2024)
TABLE 14: Segment Dashboard; Definition and Scope, by End-User
TABLE 15: Global Patient Engagement and Experience Market, by End-User 2022–2035 (USD Million)
TABLE 16: Patient Engagement and Experience Market: Regional Snapshot (2024)
TABLE 17: Segment Dashboard; Definition and Scope, by Region
TABLE 18: Global Patient Engagement and Experience Market, by Region 2022–2035 (USD Million)
TABLE 19: Patient Engagement and Experience Market, by Country (NA), 2022–2035 (USD Million)
TABLE 20: Patient Engagement and Experience Market, by Product Type (NA), 2022–2035 (USD Million)
TABLE 21: Patient Engagement and Experience Market, by Modality (NA), 2022–2035 (USD Million)
TABLE 22: Patient Engagement and Experience Market, by Service (NA), 2024–2035 (USD Million)
TABLE 23: Patient Engagement and Experience Market, by End-User (NA), 2022–2035 (USD Million)
TABLE 24: U.S. Patient Engagement and Experience Market, by Product Type, 2022–2035 (USD Million)
TABLE 25: U.S. Patient Engagement and Experience Market, by Modality, 2022–2035 (USD Million)
TABLE 26: U.S. Patient Engagement and Experience Market, by Service, 2022–2035 (USD Million)
TABLE 27: U.S. Patient Engagement and Experience Market, by End-User, 2022–2035 (USD Million)
TABLE 28: Canada Patient Engagement and Experience Market, by Product Type, 2022–2035 (USD Million)
TABLE 29: Canada Patient Engagement and Experience Market, by Modality, 2022–2035 (USD Million)
TABLE 30: Canada Patient Engagement and Experience Market, by Service, 2022–2035 (USD Million)
TABLE 31: Canada Patient Engagement and Experience Market, by End-User, 2022–2035 (USD Million)
TABLE 32: Mexico Patient Engagement and Experience Market, by Product Type, 2022–2035 (USD Million)
TABLE 33: Mexico Patient Engagement and Experience Market, by Modality, 2022–2035 (USD Million)
TABLE 34: Mexico Patient Engagement and Experience Market, by Service, 2022–2035 (USD Million)
TABLE 35: Mexico Patient Engagement and Experience Market, by End-User, 2022–2035 (USD Million)
TABLE 36: Patient Engagement and Experience Market, by Country (Europe), 2022–2035 (USD Million)
TABLE 37: Patient Engagement and Experience Market, by Product Type (Europe), 2022–2035 (USD Million)
TABLE 38: Patient Engagement and Experience Market, by Modality (Europe), 2022–2035 (USD Million)
TABLE 39: Patient Engagement and Experience Market, by Service (Europe), 2022–2035 (USD Million)
TABLE 40: Patient Engagement and Experience Market, by End-User (Europe), 2022–2035 (USD Million)
TABLE 41: Germany Patient Engagement and Experience Market, by Product Type, 2022–2035 (USD Million)
TABLE 42: Germany Patient Engagement and Experience Market, by Modality, 2022–2035 (USD Million)
TABLE 43: Germany Patient Engagement and Experience Market, by Service, 2022–2035 (USD Million)
TABLE 44: Germany Patient Engagement and Experience Market, by End-User, 2022–2035 (USD Million)
TABLE 45: Italy Patient Engagement and Experience Market, by Product Type, 2022–2035 (USD Million)
TABLE 46: Italy Patient Engagement and Experience Market, by Modality, 2022–2035 (USD Million)
TABLE 47: Italy Patient Engagement and Experience Market, by Service, 2022–2035 (USD Million)
TABLE 48: Italy Patient Engagement and Experience Market, by End-User, 2022–2035 (USD Million)
TABLE 49: United Kingdom Patient Engagement and Experience Market, by Product Type, 2022–2035 (USD Million)
TABLE 50: United Kingdom Patient Engagement and Experience Market, by Modality, 2022–2035 (USD Million)
TABLE 51: United Kingdom Patient Engagement and Experience Market, by Service, 2022–2035 (USD Million)
TABLE 52: United Kingdom Patient Engagement and Experience Market, by End-User, 2022–2035 (USD Million)
TABLE 53: France Patient Engagement and Experience Market, by Product Type, 2022–2035 (USD Million)
TABLE 54: France Patient Engagement and Experience Market, by Modality, 2022–2035 (USD Million)
TABLE 55: France Patient Engagement and Experience Market, by Service, 2022–2035 (USD Million)
TABLE 56: France Patient Engagement and Experience Market, by End-User, 2022–2035 (USD Million)
TABLE 57: Russia Patient Engagement and Experience Market, by Product Type, 2022–2035 (USD Million)
TABLE 58: Russia Patient Engagement and Experience Market, by Modality, 2022–2035 (USD Million)
TABLE 59: Russia Patient Engagement and Experience Market, by Service, 2022–2035 (USD Million)
TABLE 60: Russia Patient Engagement and Experience Market, by End-User, 2022–2035 (USD Million)
TABLE 61: Poland Patient Engagement and Experience Market, by Product Type, 2022–2035 (USD Million)
TABLE 62: Poland Patient Engagement and Experience Market, by Modality, 2022–2035 (USD Million)
TABLE 63: Poland Patient Engagement and Experience Market, by Service, 2022–2035 (USD Million)
TABLE 64: Poland Patient Engagement and Experience Market, by End-User, 2022–2035 (USD Million)
TABLE 65: Rest of Europe Patient Engagement and Experience Market, by Product Type, 2022–2035 (USD Million)
TABLE 66: Rest of Europe Patient Engagement and Experience Market, by Modality, 2022–2035 (USD Million)
TABLE 67: Rest of Europe Patient Engagement and Experience Market, by Service, 2022–2035 (USD Million)
TABLE 68: Rest of Europe Patient Engagement and Experience Market, by End-User, 2022–2035 (USD Million)
TABLE 69: Patient Engagement and Experience Market, by Country (APAC), 2022–2035 (USD Million)
TABLE 70: Patient Engagement and Experience Market, by Product Type (APAC), 2022–2035 (USD Million)
TABLE 71: Patient Engagement and Experience Market, by Modality (APAC), 2022–2035 (USD Million)
TABLE 72: Patient Engagement and Experience Market, by Service (APAC), 2022–2035 (USD Million)
TABLE 73: Patient Engagement and Experience Market, by End-User (APAC), 2022–2035 (USD Million)
TABLE 74: India Patient Engagement and Experience Market, by Product Type, 2022–2035 (USD Million)
TABLE 75: India Patient Engagement and Experience Market, by Modality, 2022–2035 (USD Million)
TABLE 76: India Patient Engagement and Experience Market, by Service, 2022–2035 (USD Million)
TABLE 77: India Patient Engagement and Experience Market, by End-User, 2022–2035 (USD Million)
TABLE 78: China Patient Engagement and Experience Market, by Product Type, 2022–2035 (USD Million)
TABLE 79: China Patient Engagement and Experience Market, by Modality, 2022–2035 (USD Million)
TABLE 80: China Patient Engagement and Experience Market, by Service, 2022–2035 (USD Million)
TABLE 81: China Patient Engagement and Experience Market, by End-User, 2022–2035 (USD Million)
TABLE 82: Japan Patient Engagement and Experience Market, by Product Type, 2022–2035 (USD Million)
TABLE 83: Japan Patient Engagement and Experience Market, by Modality, 2022–2035 (USD Million)
TABLE 84: Japan Patient Engagement and Experience Market, by Service, 2022–2035 (USD Million)
TABLE 85: Japan Patient Engagement and Experience Market, by End-User, 2022–2035 (USD Million)
TABLE 86: South Korea Patient Engagement and Experience Market, by Product Type, 2022–2035 (USD Million)
TABLE 87: South Korea Patient Engagement and Experience Market, by Modality, 2022–2035 (USD Million)
TABLE 88: South Korea Patient Engagement and Experience Market, by Service, 2022–2035 (USD Million)
TABLE 89: South Korea Patient Engagement and Experience Market, by End-User, 2022–2035 (USD Million)
TABLE 90: Australia Patient Engagement and Experience Market, by Product Type, 2022–2035 (USD Million)
TABLE 91: Australia Patient Engagement and Experience Market, by Modality, 2022–2035 (USD Million)
TABLE 92: Australia Patient Engagement and Experience Market, by Service, 2022–2035 (USD Million)
TABLE 93: Australia Patient Engagement and Experience Market, by End-User, 2022–2035 (USD Million)
TABLE 94: Rest of APAC Patient Engagement and Experience Market, by Product Type, 2022–2035 (USD Million)
TABLE 95: Rest of APAC Patient Engagement and Experience Market, by Modality, 2022–2035 (USD Million)
TABLE 96: Rest of APAC Patient Engagement and Experience Market, by Service, 2022–2035 (USD Million)
TABLE 97: Rest of APAC Patient Engagement and Experience Market, by End-User, 2022–2035 (USD Million)
TABLE 98: Brazil Patient Engagement and Experience Market, by Product Type, 2022–2035 (USD Million)
TABLE 99: Brazil Patient Engagement and Experience Market, by Modality, 2022–2035 (USD Million)
TABLE 100: Brazil Patient Engagement and Experience Market, by Service, 2022–2035 (USD Million)
TABLE 101: Brazil Patient Engagement and Experience Market, by End-User, 2022–2035 (USD Million)
TABLE 102: Argentina Patient Engagement and Experience Market, by Product Type, 2022–2035 (USD Million)
TABLE 103: Argentina Patient Engagement and Experience Market, by Modality, 2022–2035 (USD Million)
TABLE 104: Argentina Patient Engagement and Experience Market, by Service, 2022–2035 (USD Million)
TABLE 105: Argentina Patient Engagement and Experience Market, by End-User, 2022–2035 (USD Million)
TABLE 106: Colombia Patient Engagement and Experience Market, by Product Type, 2022–2035 (USD Million)
TABLE 107: Colombia Patient Engagement and Experience Market, by Modality, 2022–2035 (USD Million)
TABLE 108: Colombia Patient Engagement and Experience Market, by Service, 2022–2035 (USD Million)
TABLE 109: Colombia Patient Engagement and Experience Market, by End-User, 2022–2035 (USD Million)
TABLE 110: Rest of LATAM Patient Engagement and Experience Market, by Product Type, 2022–2035 (USD Million)
TABLE 111: Rest of LATAM Patient Engagement and Experience Market, by Modality, 2022–2035 (USD Million)
TABLE 112: Rest of LATAM Patient Engagement and Experience Market, by Service, 2022–2035 (USD Million)
TABLE 113: Rest of LATAM Patient Engagement and Experience Market, by End-User, 2022–2035 (USD Million)
TABLE 114: Israel Patient Engagement and Experience Market, by Product Type, 2022–2035 (USD Million)
TABLE 115: Israel Patient Engagement and Experience Market, by Modality, 2022–2035 (USD Million)
TABLE 116: Israel Patient Engagement and Experience Market, by Service, 2022–2035 (USD Million)
TABLE 117: Israel Patient Engagement and Experience Market, by End-User, 2022–2035 (USD Million)
TABLE 118: Turkey Patient Engagement and Experience Market, by Product Type, 2022–2035 (USD Million)
TABLE 119: Turkey Patient Engagement and Experience Market, by Modality, 2022–2035 (USD Million)
TABLE 120: Turkey Patient Engagement and Experience Market, by Service, 2022–2035 (USD Million)
TABLE 121: Turkey Patient Engagement and Experience Market, by End-User, 2022–2035 (USD Million)
TABLE 122: Egypt Patient Engagement and Experience Market, by Product Type, 2022–2035 (USD Million)
TABLE 123: Egypt Patient Engagement and Experience Market, by Modality, 2022–2035 (USD Million)
List of Figures
FIGURE 1: Patient Engagement and Experience Market Segmentation
FIGURE 2: Market Research Methodology
FIGURE 3: Value Chain Analysis
FIGURE 4: PESTLE Analysis
FIGURE 5: Porter’s Five Forces Analysis
FIGURE 6: Market Attractiveness Analysis
FIGURE 7: Market Dynamics
FIGURE 8: Innovation & Patent Landscape (2020–2024)
FIGURE 9: Competitive Landscape; Key Company Market Share Analysis, 2023
FIGURE 10: Product Type Segment Market Share Analysis, 2023 & 2035
FIGURE 11: Product Type Segment Market Size Forecast and Trend Analysis, 2024 to 2035 (USD Million)
FIGURE 12: Modality Segment Market Share Analysis, 2023 & 2035
FIGURE 13: Modality Segment Market Size Forecast and Trend Analysis, 2024 to 2035 (USD Million)
FIGURE 14: Service Segment Market Share Analysis, 2023 & 2035
FIGURE 15: Service Segment Market Size Forecast and Trend Analysis, 2024 to 2035 (USD Million)
FIGURE 16: End-User Segment Market Share Analysis, 2023 & 2035
FIGURE 17: End-User Segment Market Size Forecast and Trend Analysis, 2024 to 2035 (USD Million)
FIGURE 18: Regional Segment Market Share Analysis, 2023 & 2035
FIGURE 19: Regional Segment Market Size Forecast and Trend Analysis, 2024 to 2035 (USD Million)
FIGURE 20: North America Agricultural Biological Market Share and Leading Players, 2024
FIGURE 21: Europe Patient Engagement and Experience Market Share and Leading Players, 2024
FIGURE 22: Asia Pacific Patient Engagement and Experience Market Share and Leading Players, 2024
FIGURE 23: Latin America Patient Engagement and Experience Market Share and Leading Players, 2024
FIGURE 24: Middle East and Africa Patient Engagement and Experience Market Share and Leading Players, 2024
FIGURE 25: North America Market Share Analysis by Country, 2024
FIGURE 26: U.S. Patient Engagement and Experience Market Size, Forecast and Trend Analysis, 2024 to 2035 (USD Million)
FIGURE 27: Canada Patient Engagement and Experience Market Size, Forecast and Trend Analysis, 2024 to 2035 (USD Million)
FIGURE 28: Mexico Patient Engagement and Experience Market Size, Forecast and Trend Analysis, 2024 to 2035 (USD Million)
FIGURE 29: Europe Patient Engagement and Experience Market Share Analysis by Country, 2023
FIGURE 30: Germany Patient Engagement and Experience Market Size, Forecast and Trend Analysis, 2024 to 2035 (USD Million)
FIGURE 31: Spain Patient Engagement and Experience Market Size, Forecast and Trend Analysis, 2024 to 2035 (USD Million)
FIGURE 32: Italy Patient Engagement and Experience Market Size, Forecast and Trend Analysis, 2024 to 2035 (USD Million)
FIGURE 33: France Patient Engagement and Experience Market Size, Forecast and Trend Analysis, 2024 to 2035 (USD Million)
FIGURE 34: UK Patient Engagement and Experience Market Size, Forecast and Trend Analysis, 2024 to 2035 (USD Million)
FIGURE 35: Russia Patient Engagement and Experience Market Size, Forecast and Trend Analysis, 2024 to 2035 (USD Million)
FIGURE 36: Poland Patient Engagement and Experience Market Size, Forecast and Trend Analysis, 2024 to 2035 (USD Million)
FIGURE 37: Rest of Europe Patient Engagement and Experience Market Size, Forecast and Trend Analysis, 2024 to 2035 (USD Million)
FIGURE 38: Asia Pacific Patient Engagement and Experience Market Share Analysis by Country, 2023
FIGURE 39: India Patient Engagement and Experience Market Size, Forecast and Trend Analysis, 2024 to 2035 (USD Million)
FIGURE 40: China Patient Engagement and Experience Market Size, Forecast and Trend Analysis, 2024 to 2035 (USD Million)
FIGURE 41: Japan Patient Engagement and Experience Market Size, Forecast and Trend Analysis, 2024 to 2035 (USD Million)
FIGURE 42: South Korea Patient Engagement and Experience Market Size, Forecast and Trend Analysis, 2024 to 2035 (USD Million)
FIGURE 43: Australia Patient Engagement and Experience Market Size, Forecast and Trend Analysis, 2024 to 2035 (USD Million)
FIGURE 44: Rest of APAC Patient Engagement and Experience Market Size, Forecast and Trend Analysis, 2024 to 2035 (USD Million)
FIGURE 45: Latin America Patient Engagement and Experience Market Size, Forecast and Trend Analysis, 2024 to 2035 (USD Million)
FIGURE 46: Latin America Patient Engagement and Experience Market Share Analysis by Country, 2023
FIGURE 47: Brazil Patient Engagement and Experience Market Size, Forecast and Trend Analysis, 2024 to 2035 (USD Million)
FIGURE 48: Argentina Patient Engagement and Experience Market Size, Forecast and Trend Analysis, 2024 to 2035 (USD Million)
FIGURE 49: Colombia Patient Engagement and Experience Market Size, Forecast and Trend Analysis, 2024 to 2035 (USD Million)
FIGURE 50: Rest of LATAM Patient Engagement and Experience Market Size, Forecast and Trend Analysis, 2024 to 2035 (USD Million)
FIGURE 51: Middle East and Africa Patient Engagement and Experience Market Size, Forecast and Trend Analysis, 2024 to 2035 (USD Million)
FIGURE 52: Middle East and Africa Patient Engagement and Experience Market Share Analysis by Country, 2023
FIGURE 53: GCC Countries (Saudi Arabia, UAE, Qatar, Kuwait, Oman, Bahrain) Patient Engagement and Experience Market Size, Forecast and Trend Analysis, 2024 to 2035 (USD Million)
FIGURE 54: Israel Patient Engagement and Experience Market Size, Forecast and Trend Analysis, 2024 to 2035 (USD Million)
FIGURE 55: Turkey Patient Engagement and Experience Market Size, Forecast and Trend Analysis, 2024 to 2035 (USD Million)
FIGURE 56: Egypt Patient Engagement and Experience Market Size, Forecast and Trend Analysis, 2024 to 2035 (USD Million)
FIGURE 57: Rest of MEA Patient Engagement and Experience Market Size, Forecast and Trend Analysis, 2024 to 2035 (USD Million)
- “We were in the middle of evaluating our digital transformation roadmap when we came across this report. The breakdown of engagement models and patient satisfaction metrics helped us benchmark against top-performing systems. The evidence-backed insights into mobile-first strategies, patient portal optimization, and omnichannel communication gave our leadership the clarity needed to realign our investments. It’s not just a report, it’s a strategic asset.”
- Jessica Clarke, Director of Patient Innovation, U.S.-based Health Network
- “We used this report to refine our go-to-market approach for a new patient engagement platform. It gave us a clear view of market dynamics, patient behavior trends, and regulatory landscapes across Western and Central Europe. What stood out was the expert commentary and interpretation of patient satisfaction indicators, it went beyond raw numbers to deliver actionable intelligence. A highly credible and professionally written resource.”
- Elena Petrova, Market Strategy Manager, European Medical Tech Consortium
- “The level of depth in this report is truly impressive. From telehealth integration to culturally adaptive patient engagement tools, the analysis reflected the specific challenges we face in the Asia-Pacific region. It helped our team build a business case for implementing automated patient outreach tools across primary care clinics. I particularly valued the regional case studies and KPIs, it gave us both the data and the confidence to act.”
- Rajiv Mehta, Healthcare Transformation Lead, Asia-Pacific Health Systems
This “Patient Engagement and Experience Market 2025” report has been meticulously authored by the healthcare research team at Quants & Trends, a specialized healthcare market intelligence provider with over a decade of experience in delivering actionable insights across evolving healthcare domains. Our team comprises industry analysts, data scientists, and healthcare consultants with extensive field expertise in patient-centric care models, digital transformation, and health IT strategy.
Each data point, trend forecast, and strategic recommendation in this report is backed by in-depth primary and secondary research, real-time stakeholder interviews, and validated forecasting models. With a strong foundation in evidence-based market research, our reports are frequently used by C-suite executives, innovation leads, strategy consultants, and product managers across hospitals, health tech startups, pharmaceutical companies, and government agencies.
This particular report on Patient Engagement and Experience goes beyond market sizing, it explores behavioral insights, regulatory frameworks, digital interface adoption rates, and case studies to help stakeholders make informed decisions. Whether you're exploring omnichannel engagement solutions, patient portal optimization, or AI-driven communication tools, this report serves as a valuable decision-support framework.
We are proud to help businesses not only understand where the market is headed but also uncover how to lead it. For more insights and continuous updates from our expert team, follow us on LinkedIn where we share thought leadership and industry commentary.