Market Outlook
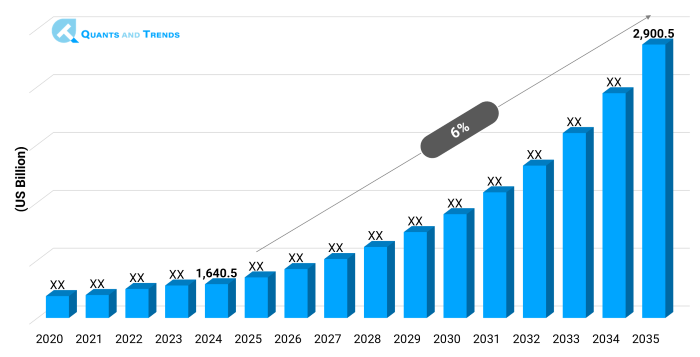
The global Pharmaceutical Industry Market size was valued at USD 1,640.5 billion in 2024 and is expected to reach around USD 2,900.5 billion by 2035, growing at a CAGR of 6% from 2025 to 2035. The historical analysis starts from 2020 to 2023 with 2024 as the base year and forecasts beginning from 2025 to 2035.
Scientific advancement, shifting healthcare needs along with changing regulatory frameworks are all contributing to the pharmaceutical's industry rapid transformation. Treatment choices for very acute & chronic illnesses are changing as a result of developments in precision medicine, drug discovery, and biologics. Demographic trends like aging populations, an increase in lifestyle related to illnesses and expanding access to healthcare in developing countries are also creating an impact on global demand. Research pipelines are still robust but companies are also handling matters of affordability and fair distribution. As more and more people focus on combining sophisticated manufacturing, supply chain resilience and patient centered care approaches, the market will be very competitive and full of chances over the next 10 years.
| Base Year | 2024 |
|---|---|
| Forecast Period | 2025-2035 |
| Historical Period | 2020-2023 |
| CAGR | 6% |
| Market Value In 2024 | USD 1,640.5 billion |
| Market Value In 2035 | USD 2,900.5 billion |
Introduction
The pharmaceutical industry is a cornerstone of modern healthcare, encompassing the research & development, manufacturing along with distribution of medicines that improve and save lives. It is an important part of preventing, treating & managing a wide range of diseases, from simple generics to complicated biologics. In the past few years, the industry has gone through tremendous changes, such as stricter rules from regulators, problems in the global supply chain and quick adoption of new technologies. New markets are growing quickly and older markets are still coming up with new specialty drugs and personalized treatments. This changing environment calls for flexibility, teamwork and a strong dedication to improving patient results and making care more accessible.
Key Market Drivers: What’s Fueling the Pharmaceutical Industry Market Boom?
- Rising Burden of Chronic Diseases-The pharmaceutical industry is growing owing to increase diseases like diabetes, cardiovascular disease, cancer and respiratory disorders. The World Health Organization says that non-communicable diseases cause 74% of deaths around the world. This means that there is a constant need for new, cheap medicines. This demand is making drug companies spend a lot of money on R&D, especially for targeted therapies and long term treatment choices. The trend is especially strong in low & middle income countries where access to treatment is growing along with improvements to healthcare infrastructure.
- Advancements in Biologics and Biosimilars- Biologics have become an important therapy option for complicated disease as they work better and target specific areas better than general medications. The global biologics market is expected to grow quickly and biosimilars will help make them more affordable and available to more patients. Regulatory help in places like the EU, the US, and Asia-Pacific has sped up the approval of biosimilars, which has made the competition even tougher. Pharmaceutical businesses are using cutting edge biotechnology platforms to create new compounds, improve production and fulfill the needs of many patients. This part of the business is likely to stay one of the most competitive and profitable.
Note: Charts and figures are illustrative only. Contact us for verified market data.
Innovation in Focus: How Manufacturers Are Raising the Bar?
The pharmaceutical industry is open to new ideas at every step starting from using AI to look for new drugs to 3D printing medicines along with customizing doses. More people are interested in precision medicine. It make treatments which are very specific to each person by using genetic and biomarker data. Digital health technology, like mobile apps and remote monitoring tools is helping patients stick to their treatment plans and get involved. Automation and continuous processing are making quality control better and costs lower in production. This combination of science and technology is making it harder to make new medicines that work quickly, safely, and well.
Recent Developments:
- In 2024, Pfizer said it would work with Flagship Pioneering to make novel mRNA-based treatments for cancer and rare genetic illnesses, in addition to infectious diseases.
- Novartis started a global patient access program that makes cancer drugs more inexpensive in more than 20 low- and middle-income nations.
Conclusion
The pharmaceutical industry is at a key point where new ideas, ease of access along with low prices all come together. Chronic diseases keep people needing treatment & biologics are changing the ways treatment work. This makes the industry both hard and rewarding for everyone involved. Digital health integration, AI-powered R&D and advanced manufacturing are speeding up the process of making drugs and opening up new treatment options. Companies will only be successful if they can deal with complicated rules, high prices and the need for global health equity. As the industry changes those who combine scientific excellence with patient centered strategies and the ability to adapt quickly will have the best chances.
Related Reports
- The global Drug Discovery Services Market was valued at approximately USD 21.5 billion in 2024 and is projected to grow at a compound annual growth rate (CAGR) of 14.6% from 2025 to 2035, reaching around USD 96.3 billion by the end of the forecast period.
- The global Pharmaceutical Manufacturing Market was valued at approximately USD 584.2 billion in 2024 and is projected to grow at a compound annual growth rate (CAGR) of 12.4% from 2025 to 2035, reaching around USD 2,110.9 billion by the end of the forecast period.
Key Market Players
The Chronic Disease Management Competitive Landscape in pharmaceuticals is defined by large multinational corporations and specialized biotech firms. Mergers, acquisitions, and licensing agreements are common ways for companies to grow their pipelines and reach more customers. Adopting new technologies, helping patients, and working with digital health providers are all ways that competition is changing. Some of the most important people in the pharmaceutical industry are as follows:
Pfizer, Johnson & Johnson, Novartis, Merck & Co., Roche, Sanofi, GlaxoSmithKline, AstraZeneca, AbbVie, Bristol Myers Squibb, Eli Lilly, Amgen, Gilead Sciences, Bayer AG, Takeda Pharmaceuticals
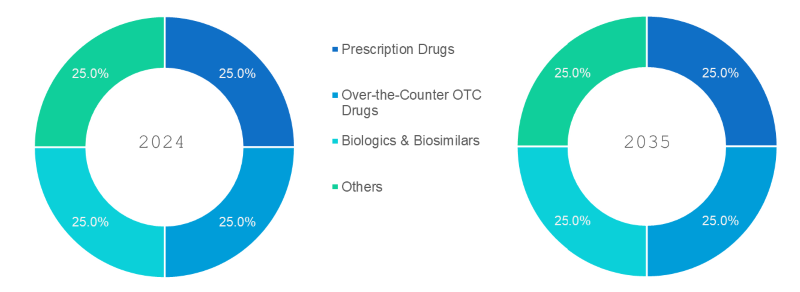
- Prescription Drugs – Remains the dominating segment, driven by strong demand for chronic disease management and specialty treatments.
- Over-the-Counter (OTC) Drugs – Steady growth due to consumer self-care trends and easy availability.
- Biologics & Biosimilars – Fastest-growing segment, propelled by rising approvals, competitive pricing, and wider therapeutic applications.
- Others – Includes vaccines, nutraceuticals, and niche formulations addressing rare conditions.
Note: Charts and figures are illustrative only. Contact us for verified market data.
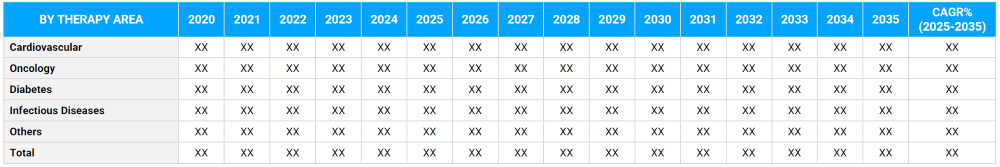
- Cardiovascular – Dominating therapy segment, owing to high prevalence and continuous drug innovation.
- Oncology – Fastest-growing segment, with targeted therapies and immuno-oncology driving rapid advancements.
- Diabetes – Consistent growth fueled by increasing incidence rates globally.
- Infectious Diseases – Remains important, particularly with emerging viral threats and antimicrobial resistance.
- Others – Covers respiratory, neurological, and autoimmune disorders.
Note: Charts and figures are illustrative only. Contact us for verified market data.
- Tablets & Capsules – Dominating formulation, preferred for convenience, stability, and cost-effectiveness.
- Injectables – Fastest-growing, especially in biologics, vaccines, and hospital-administered drugs.
- Topicals – Stable demand in dermatology and localized treatment markets.
- Others – Includes inhalers, patches, and specialized delivery systems.
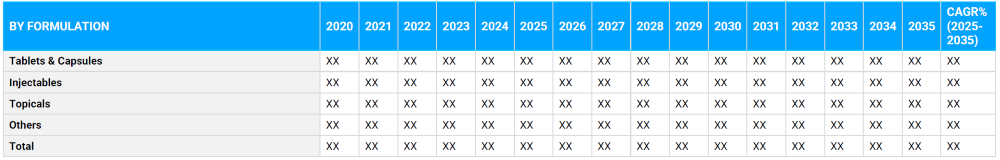
Note: Charts and figures are illustrative only. Contact us for verified market data.
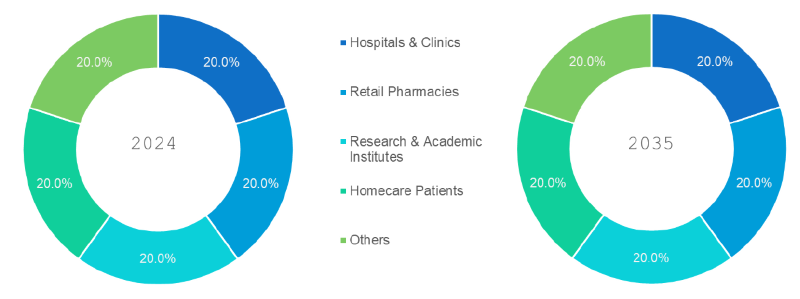
- Hospitals & Clinics – Dominating end user, due to large-scale procurement for acute and chronic care.
- Retail Pharmacies – Vital for both prescription and OTC drug distribution.
- Research & Academic Institutes – Key role in clinical trials and drug development partnerships.
- Homecare Patients – Fastest-growing, supported by telemedicine and remote prescription services.
- Others – Includes NGOs, military medical units, and public health programs.
Note: Charts and figures are illustrative only. Contact us for verified market data.
Segmentation By Region
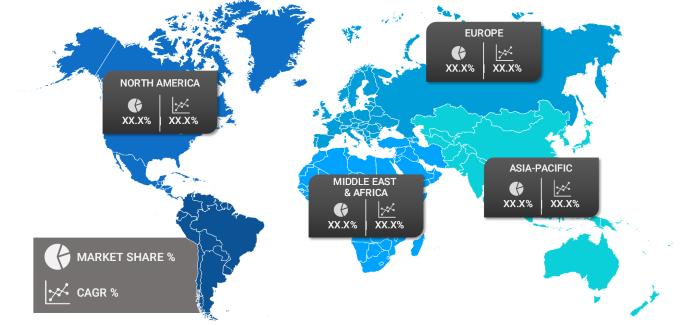
Where the Market is Growing Fastest?
North America is still the biggest part of the Pharmaceutical Industry Market Size & Share. This is because of high investments in research and development, a strong healthcare system, and good reimbursement systems. Asia-Pacific is the region that is growing the fastest. This is because healthcare access is getting better, the government is doing things to help, and manufacturing costs are going down. Through regulatory harmonization and new specialized medications, Europe stays a strong player in the market. Emerging markets in Latin America, the Middle East, and Africa are looking good since healthcare spending and infrastructure are getting better.
The following nations and regions will be covered in the report:
• North America: U.S., Canada and Mexico
• Asia Pacific: China, India, Japan, South Korea, Australia, among others
• Europe: Germany, France, Italy, Spain, UK, Russia, Rest of Europe
• Latin America: Brazil, Argentina, Colombia
• Middle East & Africa: Saudi Arabia, UAE, South Africa, Israel, Turkey
Note: Charts and figures are illustrative only. Contact us for verified market data.
1. Pharmaceutical Industry Market: Market Introduction & Context
1.1. Market Definition
1.2. Scope of the Study
1.3. Research Methodology
1.3.1. Primary Data Collection
1.3.2. Secondary Data Sourcing
1.3.3. External Industry Collaborations
1.3.4. In-House Research Databases
1.3.5. Analytical Frameworks & Forecasting End-Users
1.3.6. Data Validation and Final Report Publishing
1.4. Key Assumptions
1.5. Market Ecosystem Overview
1.6. Stakeholder Analysis (Manufacturers, Suppliers, Growers, Distributors, Retailers)
(introduces the report’s scope, methodology, and assumptions to help the client clearly understand the study's coverage, data sources, and reliability)
2. Pharmaceutical Industry Market: Executive Summary
2.1. Key Insights & Market Snapshots
2.2. Analyst Viewpoint
2.3. Market Attractiveness Index
(offers a brief yet insightful market summary, giving the client a quick grasp of key trends, market potential, and strategic highlights)
3. Pharmaceutical Industry Market: Market Dynamics & Outlook
3.1. Drivers and their impact analysis
3.2. Restraints and their impact analysis
3.3. Opportunities and their impact analysis (Emerging Markets, New Product Categories)
3.4. Patent & Innovation Analysis (2020–2024)
(explains the major drivers, restraints, opportunities, and challenges shaping the market, enabling the client to assess both growth prospects and potential risks)
4. Pharmaceutical Industry Market: Market Environment & Industry
4.1. PESTEL Analysis
4.1.1. Political
4.1.2. Economic
4.1.3. Social
4.1.4. Technological
4.1.5. Environmental
4.1.6. Legal
4.2. Porter’s Five Forces Analysis
4.2.1. Threat of New Entrants
4.2.2. Bargaining Power of Buyers
4.2.3. Bargaining Power of Suppliers
4.2.4. Substitution Risk
4.2.5. Competitive Rivalry
4.3. Pricing Trend Analysis by Region (2024–2030)
4.4. Value Chain & Supply Chain Analysis
4.5. Impact of Digitalization
4.6. End-User & Innovation Landscape
4.7. Regulatory Framework Analysis
4.7.1. Global & Regional Regulations
4.7.1.1. North America
4.7.1.2. Europe
4.7.1.3. APAC
4.7.1.4. LATAM
4.7.1.5. MEA
4.8. Import/Export Restrictions & Tariff Impact
4.9. Government Initiatives
4.10. Impact of Escalating Geopolitical Tensions
(provides an overview of the industry landscape, covering market dynamics, technological advancements, pricing trends, and regulatory influences for informed decision-making)
5. Pharmaceutical Industry Market – By Product Type
5.1. Overview
5.1.1. Segment Share Analysis, By Product Type, 2024 & 2035 (%)
5.1.2. Prescription Drugs
5.1.3. Over-the-Counter (OTC) Drugs
5.1.4. Biologics & Biosimilars
5.1.5. Others
(presents market segmentation by Product Type, guiding the client on the product categories that are expected to drive demand and shape future revenue streams)
6. Pharmaceutical Industry Market – By Therapy Area
6.1. Overview
6.1.1. Segment Share Analysis, By Therapy Area, 2024 & 2035 (%)
6.1.2. Cardiovascular
6.1.3. Oncology
6.1.4. Diabetes
6.1.5. Infectious Diseases
6.1.6. Others
(breaks down the market by Therapy Area, assisting the client in identifying material or origin preferences and emerging growth segments)
7. Pharmaceutical Industry Market – By End-User
7.1. Overview
7.1.1. Segment Share Analysis, By End-User, 2024 & 2035 (%)
7.1.2. Hospitals & Clinics
7.1.3. Retail Pharmacies
7.1.4. Research & Academic Institutes
7.1.5. Homecare Patients
7.1.6. Others
(focuses on market segmentation by End-User, helping the client prioritize specific crop Product Types or end-use areas that offer significant business opportunities)
8. Pharmaceutical Industry Market – By Formulation
8.1. Overview
8.1.1. Segment Share Analysis, By Formulation, 2024 & 2035 (%)
8.1.2. Tablets & Capsules
8.1.3. Injectables
8.1.4. Topicals
8.1.5. Others
(breaks down the market by type of Formulation, helping stakeholders understand user accessibility preferences and compatibility trends across regions and use-cases)
9. Pharmaceutical Industry Market– By Geography
9.1. Introduction
9.1.1. Segment Share Analysis, By Geography, 2024 & 2035 (%)
9.2. North America
9.2.1. Regional Overview & Trends
9.2.2. Pharmaceutical Industry Key Manufacturers in North America
9.2.3. North America Market Size and Forecast, By Country, 2024 - 2035 (US$ Million)
9.2.4. North America Market Size and Forecast, By Product Type, 2024 - 2035 (US$ Million)
9.2.5. North America Market Size and Forecast, By Therapy Area, 2024 - 2035 (US$ Million)
9.2.6. North America Market Size and Forecast, By Formulation, 2024 - 2035 (US$ Million)
9.2.7. North America Market Size and Forecast, By End-User, 2024 - 2035 (US$ Million)
9.2.8. U.S.
9.2.8.1. Overview
9.2.8.2. U.S. Market Size and Forecast, By Product Type, 2024 - 2035 (US$ Million)
9.2.8.3. U.S. Market Size and Forecast, By Therapy Area, 2024 - 2035 (US$ Million)
9.2.8.4. U.S. Market Size and Forecast, By End-User, 2024 - 2035 (US$ Million)
9.2.8.5. U.S. Market Size and Forecast, By Formulation, 2024 - 2035 (US$ Million)
9.2.9. Canada
9.2.9.1. Overview
9.2.9.2. Canada Market Size and Forecast, By Product Type, 2024 - 2035 (US$ Million)
9.2.9.3. Canada Market Size and Forecast, By Therapy Area, 2024 - 2035 (US$ Million)
9.2.9.4. Canada Market Size and Forecast, By End-User, 2024 - 2035 (US$ Million)
9.2.9.5. Canada Market Size and Forecast, By Formulation, 2024 - 2035 (US$ Million)
9.2.10. Mexico
9.2.10.1. Overview
9.2.10.2. Mexico Market Size and Forecast, By Product Type, 2024 - 2035 (US$ Million)
9.2.10.3. Mexico Market Size and Forecast, By Therapy Area, 2024 - 2035 (US$ Million)
9.2.10.4. Mexico Market Size and Forecast, By End-User, 2024 - 2035 (US$ Million)
9.2.10.5. Mexico Market Size and Forecast, By Formulation, 2024 - 2035 (US$ Million)
Note: Similar information and analysis will be provided for all other regions (Europe, APAC, LATAM and MEA) and countries listed in the subsequent sections.
9.3. Europe
9.3.1. Germany
9.3.2. Italy
9.3.3. United Kingdom
9.3.4. France
9.3.5. Russia
9.3.6. Poland
9.3.7. Rest of Europe
9.4. Asia Pacific (APAC)
9.4.1. India
9.4.2. China
9.4.3. Japan
9.4.4. South Korea
9.4.5. Australia
9.4.6. Rest of APAC
9.5. Latin America
9.5.1. Brazil
9.5.2. Argentina
9.5.3. Colombia
9.5.4. Rest of LATAM
9.6. Middle East and Africa
9.6.1. Israel
9.6.2. Turkey
9.6.3. Egypt
9.6.4. Rest of MEA
(delivers a detailed regional and country-level analysis, supporting the client in recognizing growth hotspots and strategically allocating resources across geographies)
10. Pharmaceutical Industry Market: Competitive Landscape & Company Profiles
10.1. Market Share Analysis (2024)
10.2. Company Positioning Matrix (Leaders, Innovators, Emerging Players)
10.3. Company Profiles (Key Players: Overview, Products, Strategies, Financials, Recent Developments)
10.3.1. Pfizer
10.3.2. Johnson & Johnson
10.3.3. Novartis, Merck & Co.
10.3.4. Roche
10.3.5. Sanofi
10.3.6. GlaxoSmithKline
10.3.7. AstraZeneca
10.3.8. AbbVie
10.3.9. Bristol Myers Squibb
10.3.10. Eli Lilly
10.3.11. Amgen
10.3.12. Gilead Sciences
10.3.13. Bayer AG
10.3.14. Takeda Pharmaceuticals
10.3.15. Others
Note: All company profiles will include details under the standard heads mentioned in section 10.3 - Overview, Products, Strategies, Financials, and Recent Developments. We also offer customization of the company profiling section based on your specific requirements.
(provides an assessment of key competitors, market shares, and strategic developments, giving the client essential insights to benchmark against or collaborate with industry leaders)
11. Pharmaceutical Industry Market: Future Market Outlook (2025–2035)
11.1. Scenario Analysis (Optimistic, Realistic, Pessimistic)
11.2. Disruptive Technologies Impact
11.3. Emerging Business Trends
11.4. Business Opportunities for startups and existing players
(presents market forecasts and future outlook scenarios, preparing the client for upcoming trends, innovations, and potential shifts in market structure)
12. Pharmaceutical Industry Market: Strategic Recommendations
(offers strategic recommendations for various stakeholders, enabling the client to make informed business decisions that maximize growth and minimize risks)
13. Pharmaceutical Industry Market: Disclaimer
(states the report’s disclaimers and legal boundaries, ensuring the client understands the terms of use, limitations, and responsibilities associated with the report)
List of Tables
TABLE 1: List of Data Sources
TABLE 2: Market Drivers; Impact Analysis
TABLE 3: Market Restraints; Impact Analysis
TABLE 4: Pharmaceutical Industry Market: Product Type Snapshot (2024)
TABLE 5: Segment Dashboard; Definition and Scope, by Product Type
TABLE 6: Global Pharmaceutical Industry Market, by Product Type 2022–2035 (USD Million)
TABLE 7: Pharmaceutical Industry Market: Therapy Area Snapshot (2024)
TABLE 8: Segment Dashboard; Definition and Scope, by Therapy Area
TABLE 9: Global Pharmaceutical Industry Market, by Therapy Area 2022–2035 (USD Million)
TABLE 10: Pharmaceutical Industry Market: End-User Snapshot (2024)
TABLE 11: Segment Dashboard; Definition and Scope, by End-User
TABLE 12: Global Pharmaceutical Industry Market, by End-User 2022–2035 (USD Million)
TABLE 13: Pharmaceutical Industry Market: Formulation Snapshot (2024)
TABLE 14: Segment Dashboard; Definition and Scope, by Formulation
TABLE 15: Global Pharmaceutical Industry Market, by Formulation 2022–2035 (USD Million)
TABLE 16: Pharmaceutical Industry Market: Regional Snapshot (2024)
TABLE 17: Segment Dashboard; Definition and Scope, by Region
TABLE 18: Global Pharmaceutical Industry Market, by Region 2022–2035 (USD Million)
TABLE 19: Pharmaceutical Industry Market, by Country (North America), 2022–2035 (USD Million)
TABLE 20: Pharmaceutical Industry Market, by Product Type (North America), 2022–2035 (USD Million)
TABLE 21: Pharmaceutical Industry Market, by Therapy Area (North America), 2022–2035 (USD Million)
TABLE 22: Pharmaceutical Industry Market, by Formulation (North America), 2022–2035 (USD Million)
TABLE 23: Pharmaceutical Industry Market, by End-User (North America), 2022–2035 (USD Million)
TABLE 24: U.S. Pharmaceutical Industry Market, by Product Type, 2022–2035 (USD Million)
TABLE 25: U.S. Pharmaceutical Industry Market, by Therapy Area, 2022–2035 (USD Million)
TABLE 26: U.S. Pharmaceutical Industry Market, by Formulation, 2022–2035 (USD Million)
TABLE 27: U.S. Pharmaceutical Industry Market, by End-User, 2022–2035 (USD Million)
TABLE 28: Canada Pharmaceutical Industry Market, by Product Type, 2022–2035 (USD Million)
TABLE 29: Canada Pharmaceutical Industry Market, by Therapy Area, 2022–2035 (USD Million)
TABLE 30: Canada Pharmaceutical Industry Market, by Formulation, 2022–2035 (USD Million)
TABLE 31: Canada Pharmaceutical Industry Market, by End-User, 2022–2035 (USD Million)
TABLE 32: Mexico Pharmaceutical Industry Market, by Product Type, 2022–2035 (USD Million)
TABLE 33: Mexico Pharmaceutical Industry Market, by Therapy Area, 2022–2035 (USD Million)
TABLE 34: Mexico Pharmaceutical Industry Market, by Formulation, 2022–2035 (USD Million)
TABLE 35: Mexico Pharmaceutical Industry Market, by End-User, 2022–2035 (USD Million)
TABLE 36: China Pharmaceutical Industry Market, by Product Type, 2022–2035 (USD Million)
TABLE 37: China Pharmaceutical Industry Market, by Therapy Area, 2022–2035 (USD Million)
TABLE 38: China Pharmaceutical Industry Market, by Formulation, 2022–2035 (USD Million)
TABLE 39: China Pharmaceutical Industry Market, by End-User, 2022–2035 (USD Million)
TABLE 40: India Pharmaceutical Industry Market, by Product Type, 2022–2035 (USD Million)
TABLE 41: India Pharmaceutical Industry Market, by Therapy Area, 2022–2035 (USD Million)
TABLE 42: India Pharmaceutical Industry Market, by Formulation, 2022–2035 (USD Million)
TABLE 43: India Pharmaceutical Industry Market, by End-User, 2022–2035 (USD Million)
TABLE 44: Japan Pharmaceutical Industry Market, by Product Type, 2022–2035 (USD Million)
TABLE 45: Japan Pharmaceutical Industry Market, by Therapy Area, 2022–2035 (USD Million)
TABLE 46: Japan Pharmaceutical Industry Market, by Formulation, 2022–2035 (USD Million)
TABLE 47: Japan Pharmaceutical Industry Market, by End-User, 2022–2035 (USD Million)
TABLE 48: South Korea Pharmaceutical Industry Market, by Product Type, 2022–2035 (USD Million)
TABLE 49: South Korea Pharmaceutical Industry Market, by Therapy Area, 2022–2035 (USD Million)
TABLE 50: South Korea Pharmaceutical Industry Market, by Formulation, 2022–2035 (USD Million)
TABLE 51: South Korea Pharmaceutical Industry Market, by End-User, 2022–2035 (USD Million)
TABLE 52: Australia Pharmaceutical Industry Market, by Product Type, 2022–2035 (USD Million)
TABLE 53: Australia Pharmaceutical Industry Market, by Therapy Area, 2022–2035 (USD Million)
TABLE 54: Australia Pharmaceutical Industry Market, by Formulation, 2022–2035 (USD Million)
TABLE 55: Australia Pharmaceutical Industry Market, by End-User, 2022–2035 (USD Million)
TABLE 56: Germany Pharmaceutical Industry Market, by Product Type, 2022–2035 (USD Million)
TABLE 57: Germany Pharmaceutical Industry Market, by Therapy Area, 2022–2035 (USD Million)
TABLE 58: Germany Pharmaceutical Industry Market, by Formulation, 2022–2035 (USD Million)
TABLE 59: Germany Pharmaceutical Industry Market, by End-User, 2022–2035 (USD Million)
TABLE 60: France Pharmaceutical Industry Market, by Product Type, 2022–2035 (USD Million)
TABLE 61: France Pharmaceutical Industry Market, by Therapy Area, 2022–2035 (USD Million)
TABLE 62: France Pharmaceutical Industry Market, by Formulation, 2022–2035 (USD Million)
TABLE 63: France Pharmaceutical Industry Market, by End-User, 2022–2035 (USD Million)
TABLE 64: Italy Pharmaceutical Industry Market, by Product Type, 2022–2035 (USD Million)
TABLE 65: Italy Pharmaceutical Industry Market, by Therapy Area, 2022–2035 (USD Million)
TABLE 66: Italy Pharmaceutical Industry Market, by Formulation, 2022–2035 (USD Million)
TABLE 67: Italy Pharmaceutical Industry Market, by End-User, 2022–2035 (USD Million)
TABLE 68: Spain Pharmaceutical Industry Market, by Product Type, 2022–2035 (USD Million)
TABLE 69: Spain Pharmaceutical Industry Market, by Therapy Area, 2022–2035 (USD Million)
TABLE 70: Spain Pharmaceutical Industry Market, by Formulation, 2022–2035 (USD Million)
TABLE 71: Spain Pharmaceutical Industry Market, by End-User, 2022–2035 (USD Million)
TABLE 72: U.K. Pharmaceutical Industry Market, by Product Type, 2022–2035 (USD Million)
TABLE 73: U.K. Pharmaceutical Industry Market, by Therapy Area, 2022–2035 (USD Million)
TABLE 74: U.K. Pharmaceutical Industry Market, by Formulation, 2022–2035 (USD Million)
TABLE 75: U.K. Pharmaceutical Industry Market, by End-User, 2022–2035 (USD Million)
TABLE 76: Russia Pharmaceutical Industry Market, by Product Type, 2022–2035 (USD Million)
TABLE 77: Russia Pharmaceutical Industry Market, by Therapy Area, 2022–2035 (USD Million)
TABLE 78: Russia Pharmaceutical Industry Market, by Formulation, 2022–2035 (USD Million)
TABLE 79: Russia Pharmaceutical Industry Market, by End-User, 2022–2035 (USD Million)
TABLE 80: Brazil Pharmaceutical Industry Market, by Product Type, 2022–2035 (USD Million)
TABLE 81: Brazil Pharmaceutical Industry Market, by Therapy Area, 2022–2035 (USD Million)
TABLE 82: Brazil Pharmaceutical Industry Market, by Formulation, 2022–2035 (USD Million)
TABLE 83: Brazil Pharmaceutical Industry Market, by End-User, 2022–2035 (USD Million)
TABLE 84: Argentina Pharmaceutical Industry Market, by Product Type, 2022–2035 (USD Million)
TABLE 85: Argentina Pharmaceutical Industry Market, by Therapy Area, 2022–2035 (USD Million)
TABLE 86: Argentina Pharmaceutical Industry Market, by Formulation, 2022–2035 (USD Million)
TABLE 87: Argentina Pharmaceutical Industry Market, by End-User, 2022–2035 (USD Million)
TABLE 88: Colombia Pharmaceutical Industry Market, by Product Type, 2022–2035 (USD Million)
TABLE 89: Colombia Pharmaceutical Industry Market, by Therapy Area, 2022–2035 (USD Million)
TABLE 90: Colombia Pharmaceutical Industry Market, by Formulation, 2022–2035 (USD Million)
TABLE 91: Colombia Pharmaceutical Industry Market, by End-User, 2022–2035 (USD Million)
TABLE 92: Saudi Arabia Pharmaceutical Industry Market, by Product Type, 2022–2035 (USD Million)
TABLE 93: Saudi Arabia Pharmaceutical Industry Market, by Therapy Area, 2022–2035 (USD Million)
TABLE 94: Saudi Arabia Pharmaceutical Industry Market, by Formulation, 2022–2035 (USD Million)
TABLE 95: Saudi Arabia Pharmaceutical Industry Market, by End-User, 2022–2035 (USD Million)
TABLE 96: UAE Pharmaceutical Industry Market, by Product Type, 2022–2035 (USD Million)
TABLE 97: UAE Pharmaceutical Industry Market, by Therapy Area, 2022–2035 (USD Million)
TABLE 98: UAE Pharmaceutical Industry Market, by Formulation, 2022–2035 (USD Million)
TABLE 99: UAE Pharmaceutical Industry Market, by End-User, 2022–2035 (USD Million)
TABLE 100: South Africa Pharmaceutical Industry Market, by Product Type, 2022–2035 (USD Million)
TABLE 101: South Africa Pharmaceutical Industry Market, by Therapy Area, 2022–2035 (USD Million)
TABLE 102: South Africa Pharmaceutical Industry Market, by Formulation, 2022–2035 (USD Million)
TABLE 103: South Africa Pharmaceutical Industry Market, by End-User, 2022–2035 (USD Million)
TABLE 104: Israel Pharmaceutical Industry Market, by Product Type, 2022–2035 (USD Million)
TABLE 105: Israel Pharmaceutical Industry Market, by Therapy Area, 2022–2035 (USD Million)
TABLE 106: Israel Pharmaceutical Industry Market, by Formulation, 2022–2035 (USD Million)
TABLE 107: Israel Pharmaceutical Industry Market, by End-User, 2022–2035 (USD Million)
TABLE 108: Turkey Pharmaceutical Industry Market, by Product Type, 2022–2035 (USD Million)
TABLE 109: Turkey Pharmaceutical Industry Market, by Therapy Area, 2022–2035 (USD Million)
TABLE 110: Turkey Pharmaceutical Industry Market, by Formulation, 2022–2035 (USD Million)
TABLE 111: Turkey Pharmaceutical Industry Market, by End-User, 2022–2035 (USD Million)
List of Figures
FIGURE 1: Pharmaceutical Industry Market Segmentation
FIGURE 2: Market Research Methodology
FIGURE 3: Value Chain Analysis
FIGURE 4: PESTLE Analysis
FIGURE 5: Porter’s Five Forces Analysis
FIGURE 6: Market Attractiveness Analysis
FIGURE 7: Market Dynamics
FIGURE 8: Innovation & Patent Landscape (2020–2024)
FIGURE 9: Competitive Landscape; Key Company Market Share Analysis, 2023
FIGURE 10: Product Type Segment Market Share Analysis, 2023 & 2035
FIGURE 11: Product Type Segment Market Size Forecast and Trend Analysis, 2024 to 2035 (USD Million)
FIGURE 12: Therapy Area Segment Market Share Analysis, 2023 & 2035
FIGURE 13: Therapy Area Segment Market Size Forecast and Trend Analysis, 2024 to 2035 (USD Million)
FIGURE 14: End-User Segment Market Share Analysis, 2023 & 2035
FIGURE 15: End-User Segment Market Size Forecast and Trend Analysis, 2024 to 2035 (USD Million)
FIGURE 16: Formulation Segment Market Share Analysis, 2023 & 2035
FIGURE 17: Formulation Segment Market Size Forecast and Trend Analysis, 2024 to 2035 (USD Million)
FIGURE 18: Regional Segment Market Share Analysis, 2023 & 2035
FIGURE 19: Regional Segment Market Size Forecast and Trend Analysis, 2024 to 2035 (USD Million)
FIGURE 20: North America Pharmaceutical Industry Market Share and Leading Players, 2024
FIGURE 21: Europe Pharmaceutical Industry Market Share and Leading Players, 2024
FIGURE 22: Asia Pacific Pharmaceutical Industry Market Share and Leading Players, 2024
FIGURE 23: Latin America Pharmaceutical Industry Market Share and Leading Players, 2024
FIGURE 24: Middle East and Africa Pharmaceutical Industry Market Share and Leading Players, 2024
FIGURE 25: North America Market Share Analysis by Country, 2024
FIGURE 26: U.S. Pharmaceutical Industry Market Size, Forecast and Trend Analysis, 2024 to 2035 (USD Million)
FIGURE 27: Canada Pharmaceutical Industry Market Size, Forecast and Trend Analysis, 2024 to 2035 (USD Million)
FIGURE 28: Mexico Pharmaceutical Industry Market Size, Forecast and Trend Analysis, 2024 to 2035 (USD Million)
FIGURE 29: Europe Pharmaceutical Industry Market Share Analysis by Country, 2023
FIGURE 30: Germany Pharmaceutical Industry Market Size, Forecast and Trend Analysis, 2024 to 2035 (USD Million)
FIGURE 31: Spain Pharmaceutical Industry Market Size, Forecast and Trend Analysis, 2024 to 2035 (USD Million)
FIGURE 32: Italy Pharmaceutical Industry Market Size, Forecast and Trend Analysis, 2024 to 2035 (USD Million)
FIGURE 33: France Pharmaceutical Industry Market Size, Forecast and Trend Analysis, 2024 to 2035 (USD Million)
FIGURE 34: UK Pharmaceutical Industry Market Size, Forecast and Trend Analysis, 2024 to 2035 (USD Million)
FIGURE 35: Russia Pharmaceutical Industry Market Size, Forecast and Trend Analysis, 2024 to 2035 (USD Million)
FIGURE 36: Poland Pharmaceutical Industry Market Size, Forecast and Trend Analysis, 2024 to 2035 (USD Million)
FIGURE 37: Rest of Europe Pharmaceutical Industry Market Size, Forecast and Trend Analysis, 2024 to 2035 (USD Million)
FIGURE 38: Asia Pacific Pharmaceutical Industry Market Share Analysis by Country, 2023
FIGURE 39: India Pharmaceutical Industry Market Size, Forecast and Trend Analysis, 2024 to 2035 (USD Million)
FIGURE 40: China Pharmaceutical Industry Market Size, Forecast and Trend Analysis, 2024 to 2035 (USD Million)
FIGURE 41: Japan Pharmaceutical Industry Market Size, Forecast and Trend Analysis, 2024 to 2035 (USD Million)
FIGURE 42: South Korea Pharmaceutical Industry Market Size, Forecast and Trend Analysis, 2024 to 2035 (USD Million)
FIGURE 43: Australia Pharmaceutical Industry Market Size, Forecast and Trend Analysis, 2024 to 2035 (USD Million)
FIGURE 44: Rest of APAC Pharmaceutical Industry Market Size, Forecast and Trend Analysis, 2024 to 2035 (USD Million)
FIGURE 45: Latin America Pharmaceutical Industry Market Size, Forecast and Trend Analysis, 2024 to 2035 (USD Million)
FIGURE 46: Latin America Pharmaceutical Industry Market Share Analysis by Country, 2023
FIGURE 47: Brazil Pharmaceutical Industry Market Size, Forecast and Trend Analysis, 2024 to 2035 (USD Million)
FIGURE 48: Argentina Pharmaceutical Industry Market Size, Forecast and Trend Analysis, 2024 to 2035 (USD Million)
FIGURE 49: Colombia Pharmaceutical Industry Market Size, Forecast and Trend Analysis, 2024 to 2035 (USD Million)
FIGURE 50: Rest of LATAM Pharmaceutical Industry Market Size, Forecast and Trend Analysis, 2024 to 2035 (USD Million)
FIGURE 51: Middle East and Africa Pharmaceutical Industry Market Size, Forecast and Trend Analysis, 2024 to 2035 (USD Million)
FIGURE 52: Middle East and Africa Pharmaceutical Industry Market Share Analysis by Country, 2023
FIGURE 53: GCC Countries (Saudi Arabia, UAE, Qatar, Kuwait, Oman, Bahrain) Pharmaceutical Industry Market Size, Forecast and Trend Analysis, 2024 to 2035 (USD Million)
FIGURE 54: Israel Pharmaceutical Industry Market Size, Forecast and Trend Analysis, 2024 to 2035 (USD Million)
FIGURE 55: Turkey Pharmaceutical Industry Market Size, Forecast and Trend Analysis, 2024 to 2035 (USD Million)
FIGURE 56: Egypt Pharmaceutical Industry Market Size, Forecast and Trend Analysis, 2024 to 2035 (USD Million)
FIGURE 57: Rest of MEA Pharmaceutical Industry Market Size, Forecast and Trend Analysis, 2024 to 2035 (USD Million)
- "As a portfolio strategy manager in a mid-sized pharmaceutical company in New Jersey, I found the Pharmaceutical Industry Market Research Report exceptionally valuable. The depth of competitive pipeline analysis, therapeutic area segmentation, and regulatory intelligence helped us identify high-growth categories in oncology and rare diseases. The clarity of the forecasts gave our leadership team the confidence to reprioritize our R&D budget, ensuring resources were allocated where the return on innovation would be strongest. It was not just a data-heavy document, it was a decision-making tool."
- David Reynolds, Portfolio Strategy Manager, United States
- "In the Swiss pharma ecosystem, where innovation cycles are tightly linked with global collaborations, the Pharmaceutical Industry Market Research Report served as a trusted guide. It provided nuanced insights into patent cliffs, biosimilar adoption, and evolving EMA approval trends across Europe. Our business development team in Basel used the findings to strengthen partnership discussions with biotech firms and to anticipate market shifts before competitors. The report’s transparent methodology and expert commentary reinforced our confidence in using it as a reference during high-level negotiations."
- Dr. Claudia Meier, Business Development Director, Switzerland
- "As a commercial planning lead for a pharmaceutical distributor in Seoul, I was impressed by the report’s granularity on APAC market dynamics. The Pharmaceutical Industry Market Research Report mapped out growth opportunities in vaccines, generics, and digital therapeutics with country-level insights that directly influenced our expansion strategy in South Korea and Southeast Asia. The combination of robust data, policy analysis, and practical recommendations allowed us to align our market entry plans with both regulatory realities and patient demand. It helped us make bold but calculated moves in highly competitive markets."
- Jinwoo Park, Commercial Planning Lead, South Korea
The Pharmaceutical Industry Market 2025 report has been authored by a team of senior healthcare and life sciences market research professionals with more than a decade of experience in analyzing the global pharmaceutical ecosystem. Our expertise spans therapeutic pipelines, regulatory frameworks, commercial strategies, and innovation cycles, enabling us to deliver intelligence that is both scientifically rigorous and commercially actionable.
Our analysts have supported pharmaceutical manufacturers, investors, and healthcare policymakers in making evidence-based decisions. By integrating primary interviews with industry stakeholders, detailed secondary data analysis, and proprietary forecasting models, we ensure that every insight presented is grounded in validated research and enriched with real-world context.
This report goes beyond trend spotting; it provides a decision framework. Whether you are a strategy executive assessing patent cliff risks, an investor evaluating R&D pipelines, or a business development leader exploring opportunities in emerging markets, the insights presented here will help you identify risks, seize opportunities, and build resilient strategies in a competitive pharmaceutical landscape.
Our commitment is to deliver market intelligence that bridges science, business, and policy, empowering organizations to act with clarity and confidence.
To learn more about our expertise and follow our latest healthcare market research insights, connect with us on LinkedIn.