Market Outlook
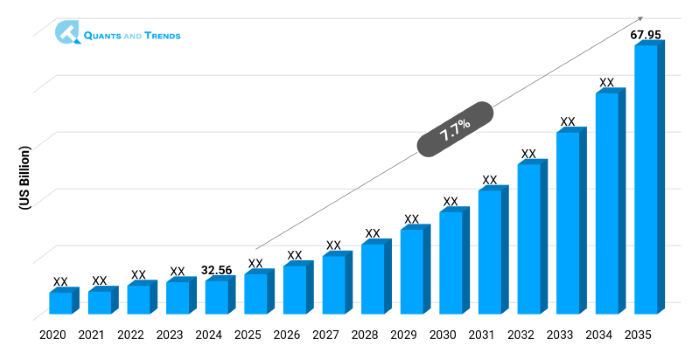
The global Biosimilar market was valued at approximately USD 32.56 billion in 2024 and is projected to grow at a compound annual growth rate (CAGR) of 7.7% from 2025 to 2035, reaching around USD 67.95 billion by the end of the forecast period. The historical analysis starts from 2020 to 2023 with 2024 as the base year and forecasts starts from 2025 to 2035.
The Biosimilar Market is experiencing a high-paced growth in the light of growing demand of cost-effective biologic therapeutics and growing incidence of chronic ailments like cancer, autoimmune disorders and diabetes. Complimented with expiry of patent of key reference biologics and with the convergence of new laws, biosimilars now appear to be a sustainable option to healthcare systems across the globe. In addition, governments are promoting the use of biosimilar to cut on the healthcare cost, which further enhances their position in the market. The recent forecast information of the biosimilar market shows that new manufacturing techniques and increasing physician comfortability are driving expansion in major markets. The most active commercialization regions are North America and Europe, although Asia-Pacific is expected to depict the greatest CAGR in the foreseen time frame. With major trends in the biosimilar sector taking hold, the worldwide biosimilar economy is getting more competitive and innovation oriented.
| Base Year | 2024 |
|---|---|
| Forecast Period | 2025-2035 |
| Historical Period | 2020-2023 |
| CAGR | 7.7% |
| Market Value In 2024 | USD 32.56 billion |
| Market Value In 2035 | USD 67.95 billion |
Introduction
Biosimilars are biologic medical products that have no material difference regarding the safety, purity, and efficacy of the already approved reference biologics. The biosimilar market is already becoming an active part of the biopharmaceutical business and may only grow stronger as the patents for some of the biologics continue to expire, and healthcare systems are forced to seek less costly therapeutic alternatives. As more people understand and increased clinical acceptance, the biosimilars are not only entering in mature markets but also making space in emerging economies. Market growth is still high due to the increase of the manufacturing abilities and the beneficial reimbursement policies. Pharmaceutical firms are placing increased focus on investment opportunities in biosimilars which is transforming the global therapeutical plans.
Key Market Drivers: What’s Fueling the Biosimilar Market Boom?
- Patent Expiry of Major Biologics: The patent expiry of the blockbuster biologics like the humira, Herceptin, and Remicade is one of the major growth drivers of the biosimilar market. With these patents hitting expiration, the race is on among manufacturers to launch their biosimilars in order to grab market share and provide cheaper versions. The trend is redefining treatment models and fostering competition among biology and reference drug manufacturers.
- Increasing Demand in Low-Cost Biologic Therapies: Biologics revolutionized the world of disease treatment yet are quite costly. Biosimilars are quite affordable and do not take away the effectiveness. Policymakers, as governments want to control spending on healthcare, and the likes of the private insurers want to cut their expenses on health treatment, have to take biosimilars into consideration as a vital part of regulation. They are also cost-effective which provides wider patient access to important treatments, especially in oncology and immunology with high market size and share development in biosimilar industry across the world.
Note: Charts and figures are illustrative only. Contact us for verified market data.
Innovation in Focus: How Manufacturers Are Raising the Bar?
The innovation changes in the biologic industry analysis are driving continuous change, especially in topics including cell line development, analytical characterization and delivery technologies. Higher platforms such as the use of single use bioreactors and continuous manufacturing have enhanced the scale and efficiency of production. Also, timelines related to the development of biosimilars and costs are getting better with the aid of AI-based model and simulation tools. Lifecycle management strategies such as next-gen biosimilars and combination therapies are also being innovated by companies that are contributing towards their differentiation and market expansions spanning multiple therapeutic categories.
Recent Developments:
In May 2025, Biocon Biologics got its adalimumab biosimilar Hulio approved by the EMA which puts Biocon in a better position in its European market.
Conclusion
The biosimilar market is in transformational phase attributable to patent expiry and rising demand in biologics, and cost-containment efforts within healthcare systems globally. The increase in the investments in R&D, strategic partnerships, and reforms in policies are exponentially contributing to the growth of biosimilar adoption across the globe. Technology, partnerships, and efficient production are where the stakeholders are placing their eyes as innovation becomes the center of the market expansion. To grow in the future market, there has to be a proper ecosystem between the regulators, manufacturers, and providers. As competition and demand grows, the size & share of the biosimilar market is projected to be highly increased, thereby leading to a more accessible and affordable drug to patients in various therapeutic lines.
Related Reports
- The global Pharmacovigilance Market was valued at approximately USD 7.65 billion in 2024 and is projected to grow at a compound annual growth rate (CAGR) of 7.1% from 2025 to 2035, reaching around USD 15.11 billion by the end of the forecast period.
- The global Oncology and Cancer Care Market was valued at approximately USD 265.1 billion in 2024 and is projected to grow at a compound annual growth rate (CAGR) of 9.8% from 2025 to 2035, reaching around USD 736.8 billion by the end of the forecast period.
Key Market Players
The international competitive environment in the biosimilar market consists of fragmentation but is moving towards consolidation with large pharma companies and smaller biotechnology companies competing aggressively. Co-development agreements, regional licensing and strategic alliances are becoming more and more popular. Business organizations are working on affordable production, regulatory aspects, and diversification by means of adding more therapeutic products. The market entry of newer players is also fast due to M&A activities. Biosimilar market report underlines the role of biosimilar lifecycle management and patent litigation plans, which ensure the competitive advantage in such a changing environment. Some of the key players in the Biosimilar industry are as:
Pfizer Inc., Amgen Inc., Samsung Bioepis, Biocon Limited, Sandoz (Novartis AG), Celltrion Healthcare, Teva Pharmaceutical Industries Ltd., Mylan N.V. (Viartis), Dr. Reddy’s Laboratories, Fresenius Kabi, Coherus BioSciences, Stada Arzneimittel AG, Intas Pharmaceuticals, Eli Lilly and Company, Apotex Inc.
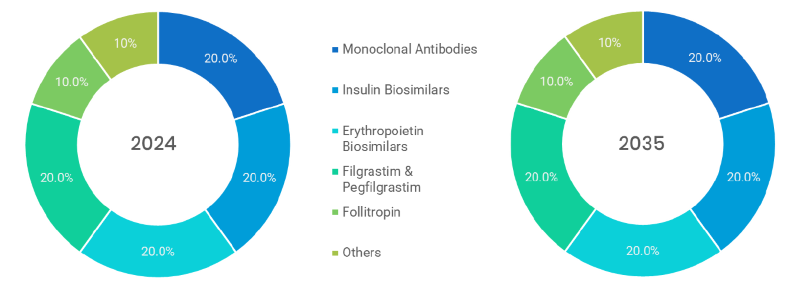
- Monoclonal Antibodies (Dominated): Targeted at cancer and autoimmune disorders; biosimilar segment is the most significant by volume, as it has high cost savings and is used in a wide range of treatment.
- Insulin Biosimilars: The cost-effective alternatives to brand insulin; strong growth potential due to the increased number of people with diabetes around the globe and their accessibility to insulin.
- Erythropoietin Biosimilars: Therapeutic use in anemia in chronic kidney disease and cancer; liberal acceptance due to cost-efficient and reliable therapeutic effects.
- Filgrastim & Pegfilgrastim (Fastest): These are administered in cases of neutropenia after chemotherapy; they are fast to adopt and effective in the oncology world because they allow quicker treatment and are more rapid.
- Follitropin: It is directed at addressing infertility problems; it is a niche market with few competitors and high clinical efficiency solution in phase hormone therapy.
- Others: Contains growth hormones, teriparatide and biosimilars in bone building (osteoporosis); smaller units with new uptake in specialist treatments.
Note: Charts and figures are illustrative only. Contact us for verified market data.
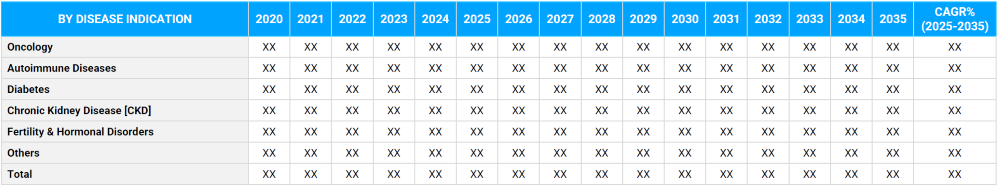
- Oncology (Dominated): The largest segment because of high cancer biologics; biosimilars enhance affordability and access to the patient receiving chemotherapy.
- Autoimmune Diseases: Increasing need in rheumatoid arthritis and psoriasis treatment; biosimilars make long term therapy affordable and accessible.
- Diabetes: Insulin biosimilars create a cost efficient way of managing diabetes in the emerging economy that has a growing number of diabetics.
- Chronic Kidney Disease (CKD): The management of anemia amongst persons with CKD, frequently applied in renal care facilities and dialysis units.
- Fertility & Hormonal Disorders (fastest): Follitropin biosimilars are used to treat hormonal disorders, infertility, etc.; there is minor, nevertheless, growing adoption in specialty clinics.
- Others: It includes the diseases such as osteoporosis and growth hormone deficiencies, and other rare diseases; the growth in them will be because of the increasing therapeutic biosimilar pipelines.
Note: Charts and figures are illustrative only. Contact us for verified market data.
- In-house Manufacturing (Dominated): Pharma companies are constructing internal production facilities as this gives them more control as well as compliance and cost efficiency in the long run with their biosimilar development.
- Contract manufacturing (Fastest): Biosimilar products made by large-scale, low-cost CDMOs; smaller or less economically equipped companies are increasingly turning to contract manufacturing.
Note: Charts and figures are illustrative only. Contact us for verified market data.
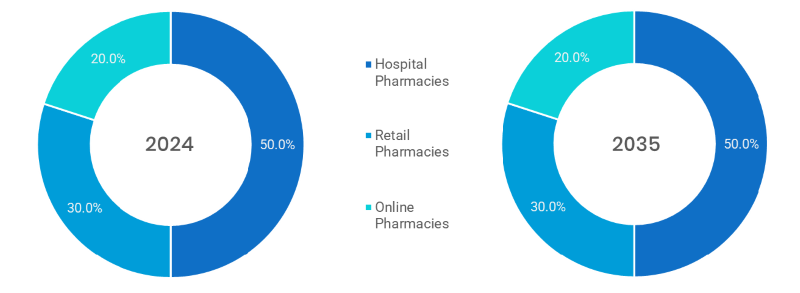
- Hospital Pharmacies (Dominated): Primary venue of injectable biosimilars in which a physician needs to administer and will be under medical supervision.
- Retail pharmacies: Involves in self-administered biosimilars, particularly insulin; rising as biosimilars become available to consumers.
- Online Pharmacies (fastest): Advanced rapidly in response to pandemic, could help bring chronic disease biosimilar therapies into homes; will accommodate medicine delivery to individuals with specific health conditions.
Note: Charts and figures are illustrative only. Contact us for verified market data.
Segmentation By Region
Where the Market is Growing Fastest?
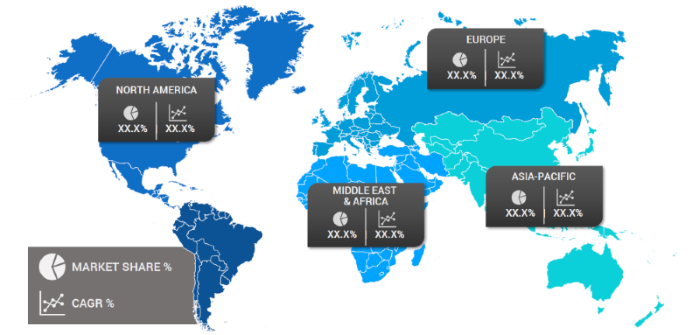
Biosimilar market has been categorized by geography into North America, Europe, Asia-Pacific, Latin America, and Middle East & Africa. Europe is dominating the overall market with early adoption of regulations, high physician awareness and popularity among payers. The fastest-growing region is Asia-Pacific, and India, South Korea and China are dominating due to their proper domestic production capabilities, regulatory reforms, and availability of patients. Rising governmental supply and rising biosimilar export is enhancing the market position of the region further. Regional analysis implies that an increase in healthcare spending and better availability of avenues of biologics are increasing the position of bio similars both in developed and emerging economies.
The following nations and regions will be covered in the report:
• North America: U.S., Canada and Mexico
• Asia Pacific: China, India, Japan, South Korea, Australia, among others
• Europe: Germany, France, Italy, Spain, UK, Russia, Rest of Europe
• Latin America: Brazil, Argentina, Colombia
• Middle East & Africa: Saudi Arabia, UAE, South Africa, Israel, Turkey
Note: Charts and figures are illustrative only. Contact us for verified market data.
1. Biosimilar Market: Market Introduction & Context
1.1. Market Definition
1.2. Scope of the Study
1.3. Research Methodology
1.3.1. Primary Data Collection
1.3.2. Secondary Data Sourcing
1.3.3. External Industry Collaborations
1.3.4. In-House Research Databases
1.3.5. Analytical Frameworks & Forecasting Distribution Channels
1.3.6. Data Validation and Final Report Publishing
1.4. Key Assumptions
1.5. Market Ecosystem Overview
1.6. Stakeholder Analysis (Manufacturers, Suppliers, Growers, Distributors, Retailers)
(introduces the report’s scope, methodology, and assumptions to help the client clearly understand the study's coverage, data sources, and reliability)
2. Biosimilar Market: Executive Summary
2.1. Key Insights & Market Snapshots
2.2. Analyst Viewpoint
2.3. Market Attractiveness Index
(offers a brief yet insightful market summary, giving the client a quick grasp of key trends, market potential, and strategic highlights)
3. Biosimilar Market: Market Dynamics & Outlook
3.1. Drivers and their impact analysis
3.2. Restraints and their impact analysis
3.3. Opportunities and their impact analysis (Emerging Markets, New Product Categories)
3.4. Patent & Innovation Analysis (2020–2024)
(explains the major drivers, restraints, opportunities, and challenges shaping the market, enabling the client to assess both growth prospects and potential risks)
4. Biosimilar Market: Market Environment & Industry
4.1. PESTEL Analysis
4.1.1. Political
4.1.2. Economic
4.1.3. Social
4.1.4. Technological
4.1.5. Environmental
4.1.6. Legal
4.2. Porter’s Five Forces Analysis
4.2.1. Threat of New Entrants
4.2.2. Bargaining Power of Buyers
4.2.3. Bargaining Power of Suppliers
4.2.4. Substitution Risk
4.2.5. Competitive Rivalry
4.3. Pricing Trend Analysis by Region (2024–2030)
4.4. Value Chain & Supply Chain Analysis
4.5. Impact of Digitalization
4.6. Product Type & Innovation Landscape
4.7. Regulatory Framework Analysis
4.7.1. Global & Regional Regulations
4.7.1.1. North America
4.7.1.2. Europe
4.7.1.3. APAC
4.7.1.4. LATAM
4.7.1.5. MEA
4.8. Import/Export Restrictions & Tariff Impact
4.9. Government Initiatives
4.10. Impact of Escalating Geopolitical Tensions
(provides an overview of the industry landscape, covering market dynamics, technological advancements, pricing trends, and regulatory influences for informed decision-making)
5. Biosimilar Market – By Product Type
5.1. Overview
5.1.1. Segment Share Analysis, By Product Type, 2024 & 2035 (%)
5.1.2. Monoclonal Antibodies
5.1.3. Insulin Biosimilars
5.1.4. Erythropoietin Biosimilars
5.1.5. Filgrastim & Pegfilgrastim
5.1.6. Follitropin
5.1.7. Others
(presents market segmentation By Product Type, guiding the client on the product categories that are expected to drive demand and shape future revenue streams)
6. Biosimilar Market – By Disease Indication
6.1. Overview
6.1.1. Segment Share Analysis, By Disease Indication, 2024 & 2035 (%)
6.1.2. Oncology
6.1.3. Autoimmune Diseases
6.1.4. Diabetes
6.1.5. Chronic Kidney Disease (CKD)
6.1.6. Fertility & Hormonal Disorders
6.1.7. Others
(breaks down the market by Disease Indication, assisting the client in identifying material or origin preferences and emerging growth segments)
7. Biosimilar Market – By Manufacturing Type
7.1. Overview
7.1.1. Segment Share Analysis, By Manufacturing Type, 2024 & 2035 (%)
7.1.2. In-house Manufacturing
7.1.3. Contract Manufacturing
(focuses on market segmentation by Manufacturing Type, helping the client prioritize specific Manufacturing Types or end-use areas that offer significant business opportunities)
8. Biosimilar Market – By Distribution Channel
8.1. Overview
8.1.1. Segment Share Analysis, By Distribution Channel, 2024 & 2035 (%)
8.1.2. Hospital Pharmacies
8.1.3. Retail Pharmacies
8.1.4. Online Pharmacies
(describes the market division by Distribution Channel of Product Type, enabling the client to understand which usage methods are preferred and where future demand may rise)
9. Biosimilar Market– By Geography
9.1. Introduction
9.1.1. Segment Share Analysis, By Geography, 2024 & 2035 (%)
9.2. North America
9.2.1. Regional Overview & Trends
9.2.2. Biosimilar Key Manufacturers in North America
9.2.3. North America Market Size and Forecast, By Country, 2024 - 2035 (US$ Million)
9.2.4. North America Market Size and Forecast, By Product Type, 2024 - 2035 (US$ Million)
9.2.5. North America Market Size and Forecast, By Disease Indication, 2024 - 2035 (US$ Million)
9.2.6. North America Market Size and Forecast, By Manufacturing Type, 2024 - 2035 (US$ Million)
9.2.7. North America Market Size and Forecast, By Distribution Channel, 2024 - 2035 (US$ Million)
9.2.8. U.S.
9.2.8.1. Overview
9.2.8.2. U.S. Market Size and Forecast, By Product Type, 2024 - 2035 (US$ Million)
9.2.8.3. U.S. Market Size and Forecast, By Disease Indication, 2024 - 2035 (US$ Million)
9.2.8.4. U.S. Market Size and Forecast, By Manufacturing Type, 2024 - 2035 (US$ Million)
9.2.8.5. U.S. Market Size and Forecast, By Distribution Channel, 2024 - 2035 (US$ Million)
9.2.9. Canada
9.2.9.1. Overview
9.2.9.2. Canada Market Size and Forecast, By Product Type, 2024 - 2035 (US$ Million)
9.2.9.3. Canada Market Size and Forecast, By Disease Indication, 2024 - 2035 (US$ Million)
9.2.9.4. Canada Market Size and Forecast, By Manufacturing Type, 2024 - 2035 (US$ Million)
9.2.9.5. Canada Market Size and Forecast, By Distribution Channel, 2024 - 2035 (US$ Million)
9.2.10. Mexico
9.2.10.1. Overview
9.2.10.2. Mexico Market Size and Forecast, By Product Type, 2024 - 2035 (US$ Million)
9.2.10.3. Mexico Market Size and Forecast, By Disease Indication, 2024 - 2035 (US$ Million)
9.2.10.4. Mexico Market Size and Forecast, By Manufacturing Type, 2024 - 2035 (US$ Million)
9.2.10.5. Mexico Market Size and Forecast, By Distribution Channel, 2024 - 2035 (US$ Million)
Note: Similar information and analysis will be provided for all other regions (Europe, APAC, LATAM and MEA) and countries listed in the subsequent sections.
9.3. Europe
9.3.1. Germany
9.3.2. Italy
9.3.3. United Kingdom
9.3.4. France
9.3.5. Russia
9.3.6. Poland
9.3.7. Rest of Europe
9.4. Asia Pacific (APAC)
9.4.1. India
9.4.2. China
9.4.3. Japan
9.4.4. South Korea
9.4.5. Australia
9.4.6. Rest of APAC
9.5. Latin America
9.5.1. Brazil
9.5.2. Argentina
9.5.3. Colombia
9.5.4. Rest of LATAM
9.6. Middle East and Africa
9.6.1. Israel
9.6.2. Turkey
9.6.3. Egypt
9.6.4. Rest of MEA
(delivers a detailed regional and country-level analysis, supporting the client in recognizing growth hotspots and strategically allocating resources across geographies)
10. Biosimilar Market: Competitive Landscape & Company Profiles
10.1. Market Share Analysis (2024)
10.2. Company Positioning Matrix (Leaders, Innovators, Emerging Players)
10.3. Company Profiles (Key Players: Overview, Products, Strategies, Financials, Recent Developments)
10.3.1. Pfizer Inc.
10.3.2. Amgen Inc.
10.3.3. Samsung Bioepis
10.3.4. Biocon Limited
10.3.5. Sandoz (Novartis AG)
10.3.6. Celltrion Healthcare
10.3.7. Teva Pharmaceutical Industries Ltd.
10.3.8. Mylan N.V. (Viartis)
10.3.9. Dr. Reddy’s Laboratories
10.3.10. Fresenius Kabi
10.3.11. Coherus BioSciences
10.3.12. Stada Arzneimittel AG
10.3.13. Intas Pharmaceuticals
10.3.14. Eli Lilly and Company
10.3.15. Apotex Inc.
10.3.16. Others
Note: All company profiles will include details under the standard heads mentioned in section 10.3 - Overview, Products, Strategies, Financials, and Recent Developments. We also offer customization of the company profiling section based on your specific requirements.
(provides an assessment of key competitors, market shares, and strategic developments, giving the client essential insights to benchmark against or collaborate with industry leaders)
11. Biosimilar Market: Future Market Outlook (2025–2035)
11.1.1. Scenario Analysis (Optimistic, Realistic, Pessimistic)
11.1.2. Disruptive Technologies Impact
11.1.3. Emerging Business Trends
11.1.4. Business Opportunities for startups and existing players
(presents market forecasts and future outlook scenarios, preparing the client for upcoming trends, innovations, and potential shifts in market structure)
12. Biosimilar Market: Strategic Recommendations
(offers strategic recommendations for various stakeholders, enabling the client to make informed business decisions that maximize growth and minimize risks)
13. Biosimilar Market: Disclaimer
(states the report’s disclaimers and legal boundaries, ensuring the client understands the terms of use, limitations, and responsibilities associated with the report)
List of Tables
TABLE 1: List of Data Sources
TABLE 2: Market Drivers; Impact Analysis
TABLE 3: Market Restraints; Impact Analysis
TABLE 4: Biosimilar Market: Product Type Snapshot (2024)
TABLE 5: Segment Dashboard; Definition and Scope, By Product Type
TABLE 6: Global Biosimilar Market, By Product Type 2022–2035 (USD Billion)
TABLE 7: Biosimilar Market: Disease Indication Snapshot (2024)
TABLE 8: Segment Dashboard; Definition and Scope, by Disease Indication
TABLE 9: Global Biosimilar Market, by Disease Indication 2022–2035 (USD Billion)
TABLE 10: Biosimilar Market: Manufacturing Type Snapshot (2024)
TABLE 11: Segment Dashboard; Definition and Scope, Manufacturing Type
TABLE 12: Global Biosimilar Market, by Manufacturing Type 2022–2035 (USD Billion)
TABLE 13: Biosimilar Market: Distribution Channel Snapshot (2024)
TABLE 14: Segment Dashboard; Definition and Scope, by Distribution Channel
TABLE 15: Global Biosimilar Market, by Distribution Channel 2022–2035 (USD Billion)
TABLE 16: Biosimilar Market: Regional Snapshot (2024)
TABLE 17: Segment Dashboard; Definition and Scope, by Region
TABLE 18: Global Biosimilar Market, by Region 2022–2035 (USD Billion)
TABLE 19: Biosimilar Market, by Country (NA), 2022–2035 (USD Billion)
TABLE 20: Biosimilar Market, By Product Type (NA), 2022–2035 (USD Billion)
TABLE 21: Biosimilar Market, by Disease Indication (NA), 2022–2035 (USD Billion)
TABLE 22: Biosimilar Market, by Manufacturing Type (NA), 2024–2035 (USD Billion)
TABLE 23: Biosimilar Market, by Distribution Channel (NA), 2022–2035 (USD Billion)
TABLE 24: U.S. Biosimilar Market, By Product Type, 2022–2035 (USD Billion)
TABLE 25: U.S. Biosimilar Market, by Disease Indication, 2022–2035 (USD Billion)
TABLE 26: U.S. Biosimilar Market, by Manufacturing Type, 2022–2035 (USD Billion)
TABLE 27: U.S. Biosimilar Market, by Distribution Channel, 2022–2035 (USD Billion)
TABLE 28: Canada Biosimilar Market, By Product Type, 2022–2035 (USD Billion)
TABLE 29: Canada Biosimilar Market, by Disease Indication, 2022–2035 (USD Billion)
TABLE 30: Canada Biosimilar Market, by Manufacturing Type, 2022–2035 (USD Billion)
TABLE 31: Canada Biosimilar Market, by Distribution Channel, 2022–2035 (USD Billion)
TABLE 32: Mexico Biosimilar Market, By Product Type, 2022–2035 (USD Billion)
TABLE 33: Mexico Biosimilar Market, by Disease Indication, 2022–2035 (USD Billion)
TABLE 34: Mexico Biosimilar Market, by Manufacturing Type, 2022–2035 (USD Billion)
TABLE 35: Mexico Biosimilar Market, by Distribution Channel, 2022–2035 (USD Billion)
TABLE 36: Biosimilar Market, by Country (Europe), 2022–2035 (USD Billion)
TABLE 37: Biosimilar Market, By Product Type (Europe), 2022–2035 (USD Billion)
TABLE 38: Biosimilar Market, by Disease Indication (Europe), 2022–2035 (USD Billion)
TABLE 39: Biosimilar Market, by Manufacturing Type(Europe), 2022–2035 (USD Billion)
TABLE 40: Biosimilar Market, by Distribution Channel (Europe), 2022–2035 (USD Billion)
TABLE 41: Germany Biosimilar Market, By Product Type, 2022–2035 (USD Billion)
TABLE 42: Germany Biosimilar Market, by Disease Indication, 2022–2035 (USD Billion)
TABLE 43: Germany Biosimilar Market, by v, 2022–2035 (USD Billion)
TABLE 44: Germany Biosimilar Market, by Distribution Channel, 2022–2035 (USD Billion)
TABLE 45: Italy Biosimilar Market, By Product Type, 2022–2035 (USD Billion)
TABLE 46: Italy Biosimilar Market, by Disease Indication, 2022–2035 (USD Billion)
TABLE 47: Italy Biosimilar Market, by Manufacturing Type, 2022–2035 (USD Billion)
TABLE 48: Italy Biosimilar Market, by Distribution Channel, 2022–2035 (USD Billion)
TABLE 49: United Kingdom Biosimilar Market, By Product Type, 2022–2035 (USD Billion)
TABLE 50: United Kingdom Biosimilar Market, by Disease Indication, 2022–2035 (USD Billion)
TABLE 51: United Kingdom Biosimilar Market, by Manufacturing Type, 2022–2035 (USD Billion)
TABLE 52: United Kingdom Biosimilar Market, by Distribution Channel, 2022–2035 (USD Billion)
TABLE 53: France Biosimilar Market, By Product Type, 2022–2035 (USD Billion)
TABLE 54: France Biosimilar Market, by Disease Indication, 2022–2035 (USD Billion)
TABLE 55: France Biosimilar Market, by Manufacturing Type, 2022–2035 (USD Billion)
TABLE 56: France Biosimilar Market, by Distribution Channel, 2022–2035 (USD Billion)
TABLE 57: Russia Biosimilar Market, By Product Type, 2022–2035 (USD Billion)
TABLE 58: Russia Biosimilar Market, by Disease Indication, 2022–2035 (USD Billion)
TABLE 59: Russia Biosimilar Market, By Product Type, 2022–2035 (USD Billion)
TABLE 60: Russia Biosimilar Market, by Distribution Channel, 2022–2035 (USD Billion)
TABLE 61: Poland Biosimilar Market, by Manufacturing Type, 2022–2035 (USD Billion)
TABLE 62: Poland Biosimilar Market, by Disease Indication, 2022–2035 (USD Billion)
TABLE 63: Poland Biosimilar Market, by Manufacturing Type, 2022–2035 (USD Billion)
TABLE 64: Poland Biosimilar Market, by Distribution Channel, 2022–2035 (USD Billion)
TABLE 65: Rest of Europe Biosimilar Market, By Product Type, 2022–2035 (USD Billion)
TABLE 66: Rest of Europe Biosimilar Market, by Disease Indication, 2022–2035 (USD Billion)
TABLE 67: Rest of Europe Biosimilar Market, by Manufacturing Type, 2022–2035 (USD Billion)
TABLE 68: Rest of Europe Biosimilar Market, by Distribution Channel, 2022–2035 (USD Billion)
TABLE 69: Biosimilar Market, by Country (APAC), 2022–2035 (USD Billion)
TABLE 70: Biosimilar Market, By Product Type (APAC), 2022–2035 (USD Billion)
TABLE 71: Biosimilar Market, by Disease Indication (APAC), 2022–2035 (USD Billion)
TABLE 72: Biosimilar Market, by Manufacturing Type(APAC), 2022–2035 (USD Billion)
TABLE 73: Biosimilar Market, by Distribution Channel (APAC), 2022–2035 (USD Billion)
TABLE 74: India Biosimilar Market, By Product Type, 2022–2035 (USD Billion)
TABLE 75: India Biosimilar Market, by Disease Indication, 2022–2035 (USD Billion)
TABLE 76: India Biosimilar Market, by Manufacturing Type, 2022–2035 (USD Billion)
TABLE 77: India Biosimilar Market, by Distribution Channel, 2022–2035 (USD Billion)
TABLE 78: China Biosimilar Market, By Product Type, 2022–2035 (USD Billion)
TABLE 79: China Biosimilar Market, by Disease Indication, 2022–2035 (USD Billion)
TABLE 80: China Biosimilar Market, by Manufacturing Type, 2022–2035 (USD Billion)
TABLE 81: China Biosimilar Market, by Distribution Channel, 2022–2035 (USD Billion)
TABLE 82: Japan Biosimilar Market, By Product Type, 2022–2035 (USD Billion)
TABLE 83: Japan Biosimilar Market, by Disease Indication, 2022–2035 (USD Billion)
TABLE 84: Japan Biosimilar Market, by Manufacturing Type, 2022–2035 (USD Billion)
TABLE 85: Japan Biosimilar Market, by Distribution Channel, 2022–2035 (USD Billion)
TABLE 86: South Korea Biosimilar Market, By Product Type, 2022–2035 (USD Billion)
TABLE 87: South Korea Biosimilar Market, by Disease Indication, 2022–2035 (USD Billion)
TABLE 88: South Korea Biosimilar Market, by Manufacturing Type, 2022–2035 (USD Billion)
TABLE 89: South Korea Biosimilar Market, by Distribution Channel, 2022–2035 (USD Billion)
TABLE 90: Australia Biosimilar Market, By Product Type, 2022–2035 (USD Billion)
TABLE 91: Australia Biosimilar Market, by Disease Indication, 2022–2035 (USD Billion)
TABLE 92: Australia Biosimilar Market, by Manufacturing Type, 2022–2035 (USD Billion)
TABLE 93: Australia Biosimilar Market, by Distribution Channel, 2022–2035 (USD Billion)
TABLE 94: Rest of APAC Biosimilar Market, By Product Type, 2022–2035 (USD Billion)
TABLE 95: Rest of APAC Biosimilar Market, by Disease Indication, 2022–2035 (USD Billion)
TABLE 96: Rest of APAC Biosimilar Market, by Manufacturing Type, 2022–2035 (USD Billion)
TABLE 97: Rest of APAC Biosimilar Market, by Distribution Channel, 2022–2035 (USD Billion)
TABLE 98: Brazil Biosimilar Market, By Product Type, 2022–2035 (USD Billion)
TABLE 99: Brazil Biosimilar Market, by Disease Indication, 2022–2035 (USD Billion)
TABLE 100: Brazil Biosimilar Market, by Manufacturing Type, 2022–2035 (USD Billion)
TABLE 101: Brazil Biosimilar Market, by Distribution Channel, 2022–2035 (USD Billion)
TABLE 102: Argentina Biosimilar Market, By Product Type, 2022–2035 (USD Billion)
TABLE 103: Argentina Biosimilar Market, by Disease Indication, 2022–2035 (USD Billion)
TABLE 104: Argentina Biosimilar Market, by Manufacturing Type, 2022–2035 (USD Billion)
TABLE 105: Argentina Biosimilar Market, by Distribution Channel, 2022–2035 (USD Billion)
TABLE 106: Colombia Biosimilar Market, By Product Type, 2022–2035 (USD Billion)
TABLE 107: Colombia Biosimilar Market, by Disease Indication, 2022–2035 (USD Billion)
TABLE 108: Colombia Biosimilar Market, by Manufacturing Type, 2022–2035 (USD Billion)
TABLE 109: Colombia Biosimilar Market, by Distribution Channel, 2022–2035 (USD Billion)
TABLE 110: Rest of LATAM Biosimilar Market, By Product Type, 2022–2035 (USD Billion)
TABLE 111: Rest of LATAM Biosimilar Market, by Disease Indication, 2022–2035 (USD Billion)
TABLE 112: Rest of LATAM Biosimilar Market, by Manufacturing Type, 2022–2035 (USD Billion)
TABLE 113: Rest of LATAM Biosimilar Market, by Distribution Channel, 2022–2035 (USD Billion)
TABLE 114: Israel Biosimilar Market, By Product Type, 2022–2035 (USD Billion)
TABLE 115: Israel Biosimilar Market, by Disease Indication, 2022–2035 (USD Billion)
TABLE 116: Israel Biosimilar Market, by Manufacturing Type, 2022–2035 (USD Billion)
TABLE 117: Israel Biosimilar Market, by Distribution Channel, 2022–2035 (USD Billion)
TABLE 118: Turkey Biosimilar Market, By Product Type, 2022–2035 (USD Billion)
TABLE 119: Turkey Biosimilar Market, by Disease Indication, 2022–2035 (USD Billion)
TABLE 120: Turkey Biosimilar Market, by Manufacturing Type, 2022–2035 (USD Billion)
TABLE 121: Turkey Biosimilar Market, by Distribution Channel, 2022–2035 (USD Billion)
TABLE 122: Egypt Biosimilar Market, By Product Type, 2022–2035 (USD Billion)
TABLE 123: Egypt Biosimilar Market, by Disease Indication, 2022–2035 (USD Billion)
TABLE 124: Egypt Biosimilar Market, by Manufacturing Type, 2022–2035 (USD Billion)
TABLE 125: Egypt Biosimilar Market, by Distribution Channel, 2022–2035 (USD Billion)
TABLE 126: Rest of MEA Biosimilar Market, By Product Type, 2022–2035 (USD Billion)
TABLE 127: Rest of MEA Biosimilar Market, by Disease Indication, 2022–2035 (USD Billion)
TABLE 128: Rest of MEA Biosimilar Market, by Manufacturing Type, 2022–2035 (USD Billion)
TABLE 129: Rest of MEA Biosimilar Market, by Distribution Channel, 2022–2035 (USD Billion)
List of Figures
FIGURE 1: Biosimilar Market Segmentation
FIGURE 2: Market Research Methodology
FIGURE 3: Value Chain Analysis
FIGURE 4: PESTLE Analysis
FIGURE 5: Porter’s Five Forces Analysis
FIGURE 6: Market Attractiveness Analysis
FIGURE 7: Market Dynamics
FIGURE 8: Innovation & Patent Landscape (2020–2024)
FIGURE 9: Competitive Landscape; Key Company Market Share Analysis, 2023
FIGURE 10: Product Type Segment Market Share Analysis, 2023 & 2035
FIGURE 11: Product Type Segment Market Size Forecast and Trend Analysis, 2024 to 2035 (USD Billion)
FIGURE 12: Disease Indication Segment Market Share Analysis, 2023 & 2035
FIGURE 13: Disease Indication Segment Market Size Forecast and Trend Analysis, 2024 to 2035 (USD Billion)
FIGURE 14: Product Type Segment Market Share Analysis, 2023 & 2035
FIGURE 15: Product Type Segment Market Size Forecast and Trend Analysis, 2024 to 2035 (USD Billion)
FIGURE 16: Distribution Channel Segment Market Share Analysis, 2023 & 2035
FIGURE 17: Distribution Channel Segment Market Size Forecast and Trend Analysis, 2024 to 2035 (USD Billion)
FIGURE 18: Regional Segment Market Share Analysis, 2023 & 2035
FIGURE 19: Regional Segment Market Size Forecast and Trend Analysis, 2024 to 2035 (USD Billion)
FIGURE 20: North America Agricultural Biological Market Share and Leading Players, 2024
FIGURE 21: Europe Biosimilar Market Share and Leading Players, 2024
FIGURE 22: Asia Pacific Biosimilar Market Share and Leading Players, 2024
FIGURE 23: Latin America Biosimilar Market Share and Leading Players, 2024
FIGURE 24: Middle East and Africa Biosimilar Market Share and Leading Players, 2024
FIGURE 25: North America Market Share Analysis by Country, 2024
FIGURE 26: U.S. Biosimilar Market Size, Forecast and Trend Analysis, 2024 to 2035 (USD Billion)
FIGURE 27: Canada Biosimilar Market Size, Forecast and Trend Analysis, 2024 to 2035 (USD Billion)
FIGURE 28: Mexico Biosimilar Market Size, Forecast and Trend Analysis, 2024 to 2035 (USD Billion)
FIGURE 29: Europe Biosimilar Market Share Analysis by Country, 2023
FIGURE 30: Germany Biosimilar Market Size, Forecast and Trend Analysis, 2024 to 2035 (USD Billion)
FIGURE 31: Spain Biosimilar Market Size, Forecast and Trend Analysis, 2024 to 2035 (USD Billion)
FIGURE 32: Italy Biosimilar Market Size, Forecast and Trend Analysis, 2024 to 2035 (USD Billion)
FIGURE 33: France Biosimilar Market Size, Forecast and Trend Analysis, 2024 to 2035 (USD Billion)
FIGURE 34: UK Biosimilar Market Size, Forecast and Trend Analysis, 2024 to 2035 (USD Billion)
FIGURE 35: Russia Biosimilar Market Size, Forecast and Trend Analysis, 2024 to 2035 (USD Billion)
FIGURE 36: Poland Biosimilar Market Size, Forecast and Trend Analysis, 2024 to 2035 (USD Billion)
FIGURE 37: Rest of Europe Biosimilar Market Size, Forecast and Trend Analysis, 2024 to 2035 (USD Billion)
FIGURE 38: Asia Pacific Biosimilar Market Share Analysis by Country, 2023
FIGURE 39: India Biosimilar Market Size, Forecast and Trend Analysis, 2024 to 2035 (USD Billion)
FIGURE 40: China Biosimilar Market Size, Forecast and Trend Analysis, 2024 to 2035 (USD Billion)
FIGURE 41: Japan Biosimilar Market Size, Forecast and Trend Analysis, 2024 to 2035 (USD Billion)
FIGURE 42: South Korea Biosimilar Market Size, Forecast and Trend Analysis, 2024 to 2035 (USD Billion)
FIGURE 43: Australia Biosimilar Market Size, Forecast and Trend Analysis, 2024 to 2035 (USD Billion)
FIGURE 44: Rest of APAC Biosimilar Market Size, Forecast and Trend Analysis, 2024 to 2035 (USD Billion)
FIGURE 45: Latin America Biosimilar Market Size, Forecast and Trend Analysis, 2024 to 2035 (USD Billion)
FIGURE 46: Latin America Biosimilar Market Share Analysis by Country, 2023
FIGURE 47: Brazil Biosimilar Market Size, Forecast and Trend Analysis, 2024 to 2035 (USD Billion)
FIGURE 48: Argentina Biosimilar Market Size, Forecast and Trend Analysis, 2024 to 2035 (USD Billion)
FIGURE 49: Colombia Biosimilar Market Size, Forecast and Trend Analysis, 2024 to 2035 (USD Billion)
FIGURE 50: Rest of LATAM Biosimilar Market Size, Forecast and Trend Analysis, 2024 to 2035 (USD Billion)
FIGURE 51: Middle East and Africa Biosimilar Market Size, Forecast and Trend Analysis, 2024 to 2035 (USD Billion)
FIGURE 52: Middle East and Africa Biosimilar Market Share Analysis by Country, 2023
FIGURE 53: GCC Countries (Saudi Arabia, UAE, Qatar, Kuwait, Oman, Bahrain) Biosimilar Market Size, Forecast and Trend Analysis, 2024 to 2035 (USD Billion)
FIGURE 54: Israel Biosimilar Market Size, Forecast and Trend Analysis, 2024 to 2035 (USD Billion)
FIGURE 55: Turkey Biosimilar Market Size, Forecast and Trend Analysis, 2024 to 2035 (USD Billion)
FIGURE 56: Egypt Biosimilar Market Size, Forecast and Trend Analysis, 2024 to 2035 (USD Billion)
FIGURE 57: Rest of MEA Biosimilar Market Size, Forecast and Trend Analysis, 2024 to 2035 (USD Billion)
- "The Biosimilar Market Research Report was instrumental in shaping our market entry strategy for North America. The competitive landscape analysis, coupled with the clear breakdown of regulatory pathways, helped our team prioritize high-potential therapeutic areas and avoid unnecessary compliance delays. The level of detail in forecasting manufacturing cost trends and potential pricing pressures gave us the confidence to make investment decisions that aligned with both short-term profitability and long-term growth objectives. This report stands out for its balance of data depth and practical application."
- Emily Carter, Senior Market Strategy Analyst, USA
- "What impressed me most about this report was the accuracy of its biosimilar adoption rate projections across European markets. It went beyond generic statistics, offering granular insights on prescriber behavior, payer reimbursement patterns, and hospital formulary decision factors. Using this intelligence, we refined our partner selection criteria and negotiation approach, which directly impacted our successful launch in two key EU regions, Germany and Spain. The quality of research clearly reflects the team’s strong industry connections and deep expertise."
- Dr. Lukas Meyer, Head of Business Development, Germany
- "The Biosimilar Market Research Report provided exactly the type of actionable intelligence our team needed to evaluate opportunities in the Asia-Pacific region. The section on evolving regulatory frameworks in Singapore, South Korea, and Australia was particularly valuable, as it identified upcoming policy changes months before they appeared in public notices. We were able to adjust our clinical trial timelines and resource allocation accordingly, saving both time and capital. The blend of scientific rigor and commercial insight in this report is rare and extremely useful."
- Aiko Tan, Strategic Planning Director, Singapore
The Biosimilar Market 2025 report has been authored by the research team at Quants and Trends, a trusted provider of in-depth healthcare market intelligence with over a decade of experience in tracking pharmaceutical innovations, regulatory shifts, and commercialization trends. Our analysts specialize in delivering actionable, evidence-based insights that bridge the gap between market potential and strategic execution.
With a strong background in biologics, biosimilars, and biopharmaceutical value chains, our team combines primary research, secondary intelligence, and advanced data modeling to forecast market trajectories with precision. Each data point in this report is backed by rigorous methodology, ranging from interviews with industry experts and key opinion leaders to analysis of policy updates, manufacturing capacity expansions, and competitive pipeline developments.
The Biosimilar Market 2025 report is designed not only to inform but to empower business leaders, regulatory teams, and investors to make high-confidence decisions in a rapidly evolving market. Whether it’s identifying the most promising therapeutic segments, understanding price-erosion risks, or mapping optimal market entry strategies, this research provides a practical blueprint for navigating both mature and emerging biosimilar landscapes.
Our commitment to transparency, accuracy, and strategic relevance has made us a trusted knowledge partner for global pharmaceutical companies, biotech firms, and healthcare investors. To learn more about our expertise and explore our latest industry insights, connect with us on LinkedIn.