Market Outlook
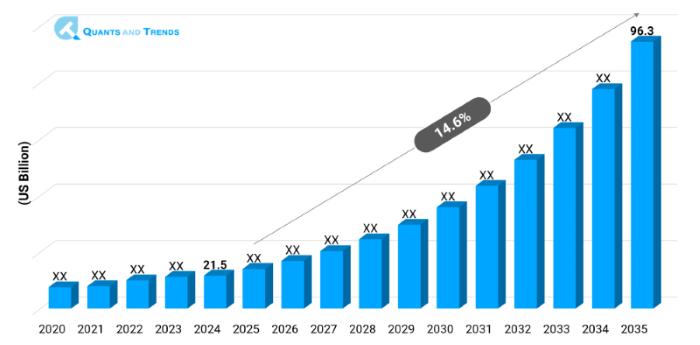
The Global Drug Discovery Services Market was valued at approximately USD 21.5 billion in 2024 and is projected to grow at a compound annual growth rate (CAGR) of 14.6% from 2025 to 2035, reaching around USD 96.3 billion by the end of the forecast period. The historical analysis starts from 2020 to 2023 with 2024 as the base year, and forecasts start from 2025 to 2035.
The market in digital health, diagnostics and personalized medicine should grow as there is a tendency of outsourcing discovery to save time-to-market and cost. Drug Discovery Services Industry Analysis is being determined by strategic alliance, regulatory alignment, and AI-based target identification. These developments demonstrate the Key Trends in Drug Discovery Services, with one of them being virtual screening and precision chemistry platforms. The market dynamics are strong with an upward trend, new modes of expansion growth, and service model business.
| Base Year | 2024 |
|---|---|
| Forecast Period | 2025-2035 |
| Historical Period | 2020-2023 |
| CAGR | 14.6% |
| Market Value In 2024 | USD 21.5 billion |
| Market Value In 2035 | USD 96.3 billion |
Introduction
The Drug Discovery Services Market Report gives an in-depth understanding of the discovery services available to be outsourced, including target identification, screening, lead optimization, preclinical models and chemistry. It examines the role of collaborations of CROs, biotech and academic interactions in changing the discovery pipelines. In Drug Discovery Services Market Size & Share, the report also classifies the segments in the service area besides analyzing Drug Discovery Services Competitive Landscape and the spread of treatment areas. Technology Adoption in Drug Discovery Services to the core in the form of AI-driven platforms, high-throughput screening, fragment-based design, and others helps the industry make a strategic shift. The report offers serviceable intelligence on investment prospect and service model expansion in a changing-state market scenario.
Key Market Drivers: What’s Fueling the Drug Discovery Services Market Boom?
- Increase in R&D Outsourcing to CROs: The biopharma organizations are turning towards contract research organization (CROs) to overcome the shortage of budget as well as resources. Such outsourcing allows scaling in the areas of target identification, hit-to-lead optimization, and toxicology studies up and down in a flexible manner. Increasing pressure to pump additional products into the pipeline and direct internal resources towards clinical development also enhances demand. Outsourcing is providing expertise and infrastructure because of which productivity improves and the risk of failure is reduced in the initial stages of drug discovery that forms an important part of Drug Discovery Services Investment Opportunities.
- Integration of AI, ML, and Automation: The evolution of AI/ML solutions to identify the target, predict the toxicity or to design a compound is a critical source of growth. Firms that make AI-enabled virtual screening, predictive ADME/Tox testing, and automated synthesis are commanding longer margins and shorter turnaround times. Such innovations are also in line with Market Dynamics and they are cheaper to work with, making decisions to go or no go much faster. When we talk about transformative possibilities in the Drug Discovery Services Market Forecast, it is worth putting more emphasis on the progressive use of automated and robotics-aided platforms.
- Emergence of Precision Medicine and Modality Diversification: The evolution of precision therapeutics bispecific, gene therapies and oligonucleotides require dedicated discovery pathways. To address this need, service providers are setting down investments in gene editing, bioinformatics and cell-based screening. This forms the Emerging Opportunities given that biotech companies are in demand of niche expertise and platforms. CROs with modality-specific workflow adaptation (e.g. CRISPR-based assays, viral vector analytics) are also growing at a faster rate.
Note: Charts and figures are illustrative only. Contact us for verified market data.
Innovation in Focus: How Manufacturers Are Raising the Bar?
Key areas of Innovation in the Drug Discovery Services Market include AI-powered De novo design, micro physiological systems (organoids) and CRISPR-driven screening. Providers are also combining real-world information and digital twins to bring about target validation. On-demand, global, scalable compute resources are researched with cloud-based collaboration platforms. Together these technologies are reducing development times and making hits more confident, and constitute a paradigm shift of traditional, linear discovery to a new, agile and model-based approach.
Recent Developments:
- In April 2025, Recursion Pharmaceuticals collaborated with a large pharma company to develop its AI-based rare disease programs, to boost the precision medicine pipeline.
- In June 2025, IQVIA bought a small phenotypic screening business to support its AI-powered target identification and analytics solutions.
Conclusion
The Market of Drug Discovery Services is on the threshold of changes with more traditional previously established segments (CMC, small molecule, oncology) shared with high-growth domains such as AI-enabled discovery, gene, and cell therapy, and boutique service models. North America is the greatest in scale and APAC in the quickest growth. The competition is moving towards service provider on a platform and consortium-based innovation. The success of the stakeholders is by implementing AI, diversification to try new modalities as well as developing flexible regional operations. The Drug Discovery Services Market Report highlights a new era of quick proliferation of innovation and improvement in efficiency and diversity in offerings of the discovery services.
Related Reports
- The global Personalized Medicine Market was valued at approximately USD 375.1 billion in 2024 and is projected to grow at a compound annual growth rate (CAGR) of 6.5% from 2025 to 2035, reaching around USD 735.6 billion by the end of the forecast period.
- The global Biotechnology Innovations Market was valued at approximately USD 115.2 billion in 2024 and is projected to grow at a compound annual growth rate (CAGR) of 9.5% from 2025 to 2035, reaching around USD 311.5 billion by the end of the forecast period.
Key Market Players
Competition is significant in the Drug Discovery Services Competitive Landscape and is characterized by mergers and Acquisitions, strategic alliances and in-house platform development. There are large CROs (e.g., Charles River, IQVIA, LabCorp: Covance) that have end-to end capabilities. The new entrants, such as Recursion Pharmaceuticals, Schrodinger, and Insilico Medicine, are at the forefront in AI and automation. Hybrid models are driven by the partnerships of giant CROs with boutiques specializing in technology. Due to increased pacing in Technology Adoption in Drug Discovery Services, providing competitiveness is shaped by incorporation of AI as well as flexible modality knowledge and global scaling to fulfil sponsor requirements. Some of the key players in the Drug Discovery Services industry are as:
Cerner (Oracle Health), Epic Systems, Allscripts, Athenahealth, Meditech, Philips Healthcare, Siemens Healthineers, IBM Watson Health, Salesforce Health Cloud, Oracle Health (Cerner), MyChart (by Epic), GetWellNetwork, Grand Rounds, Welltok (HEALOW), Teladoc Health
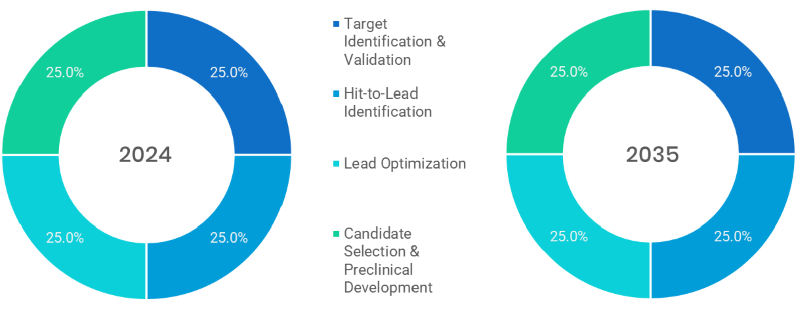
- Target Identification/Validation (Fastest-Growing): The segment is among the earliest stages of a pipeline and is related to the discovery and validation of possible biological targets of new drugs via genomic, proteomic, and AI-based platforms. The precision medicine and the growing use of computational models to discover biomarkers are its drivers of growth.
- Hit-to-Lead Identification: This is where the activities are directed to identify compounds that exhibit activity against selected targets identified by the variety of findings of the preceding target discovery and validation process. Methods such as high throughput screening (HTS) and fragment-based design are in ascendancy, in the effort to refine thousands of hits into lead candidates.
- Lead Optimization (Dominant): This leading segment is the optimization of lead compounds with requirement to enhance in their potency, selectivity, pharmacokinetics, and toxicity. It plays a pivotal role in mitigating the level of failure at preclinical, and clinical stages, and it is one of the main areas of investment by most participants (sponsors) in the field of outsourcing.
- Candidate Selection and Preclinical Development: At this phase, optimized leads are tested by using in vivo models and elaborate toxicology studies thus providing eligible drug candidates. There is a growing demand in outsourcing by attributable to the fact that sponsors seek a more efficient way of handling workflows to file regulatory submissions based on validated safety and efficacy data.
Note: Charts and figures are illustrative only. Contact us for verified market data.
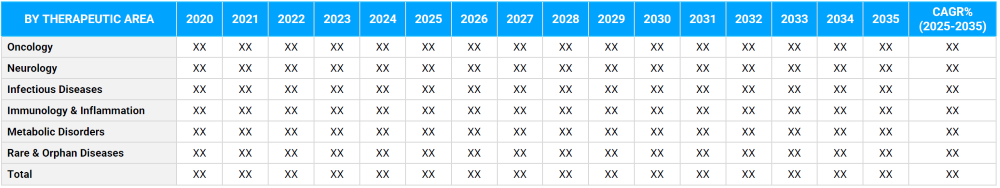
- Oncology (Dominant): Oncology, which has the largest market share, is also very on-demand because there is so much R&D going on related to cancer development. The segment is favorable to innovations in the field of immuno-oncology, targeted therapy, and biomarker-driven field, which necessitates intricate and iterative discovery processes.
- Neurology: This segment is associated with such disease as Alzheimer and Parkinson where the rate of unmet need and clinical failure is still high. The emerging iPSC models and AI-based screening mechanism are improving service providers understanding of the neurodegenerative mechanism and resulting in better discovery chances in this important field.
- Infectious Diseases (Fastest-Growing): This sector has been on fire since the end of the COVID-19 pandemic, as people are turning more and more to antimicrobial resistance and new viral challenges. Vaccine discovery, antiviral screening and development of novel antimicrobials fall under the outsourced services; funded through public-private partnerships and through global health investments.
- Immunology & inflammation: This line of work, focusing on such autoimmune and inflammatory diseases as rheumatoid arthritis or asthma, lays focus on cytokine profiling, cell-based assays, and translational research. It is being noticed because of the chronicity of these illnesses and the increasing tendency of the immunotherapeutic strategies.
- Metabolic Disorders: Including diabetes, obesity, and disorders of the cholesterol, this segment requires the healthy in vitro and in vivo model to investigate the intricate metabolic pathways. Due to an increase in lifestyle diseases all over the world, discovery work is geared towards the identification of new glucose homeostasis routes and fat metabolism.
- The Rare & Orphan Diseases: This segment of the drug discovery services market is growing quickly. Pharmaceutical companies are adding more research and development (R&D) projects for these conditions because of government incentives like the U.S. Orphan Drug Act and more people learning about them. Clinical trials are hard because there aren't many patients and there isn't enough information about the disease. But genomics and targeted therapies are making it easier and more appealing to make these drugs. The high value and high prices of approved orphan drugs help this sector to grow faster during the forecasted period.
Note: Charts and figures are illustrative only. Contact us for verified market data.
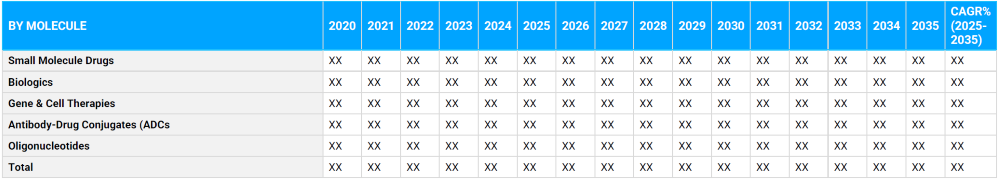
- Small Molecule Drugs (Dominant): The oldest school of modality, small molecules lead given their ease of diffusion in the body through oral consumption and the wide isosurface that is easily applicable along with any disease. Most CROs have legacy infrastructure in medicinal chemistry, optimization of ADME properties, and high-throughput libraries of compounds optimized to small molecule development.
- Biologics: They consist of big molecules such as peptides and monoclonal antibodies. Discovery work goes into protein engineering, recombinant expression, and optimization of affinity. Biologics are highly specific, and the treatment pipeline of cancer, autoimmune and infectious diseases all make use of biologics.
- Cell and Gene Therapies (Fastest-Growing): The most rapidly developing segment is the gene and cell therapy discovery that targets editing technologies (e.g. CRISPR), viral vectors, and stem cell-based assays. It takes expert knowledge and providers are putting a lot of money into development of customized assays, scalable vector, etc.
- Antibody-Drug Conjugates (ADCs): Kelley Antibody-Drug Conjugates (ADCs) are inciting coordinated uses of biologic agents with cytotoxic agents. The two common discovery services include the linker optimization, payload screening and conjugation chemistry. The oncologic application of ADCs is also growing among which ADCs exhibit reduced systemic toxicity at high potencies.
- Oligonucleotides: This is a small but expanding area and encompasses therapies based on RNA, such as antisense oligos, siRNA and mRNA platforms. Discovery efforts are being concentrated on optimization of sequence and delivery systems and profile of immunogenicity as a result of mRNA vaccine success and ease of regulatory acceptance of novel RNA therapeutics.
Note: Charts and figures are illustrative only. Contact us for verified market data.
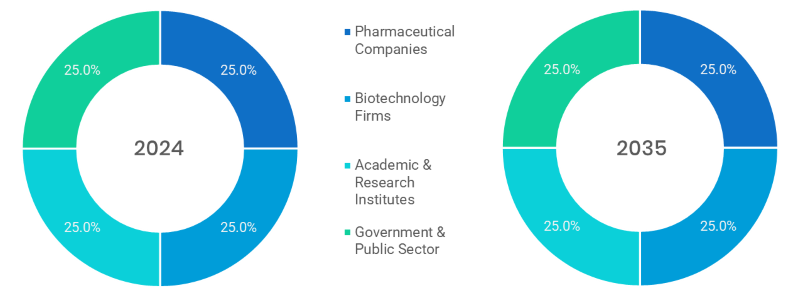
- Pharmaceutical Companies (Dominant): The biggest clients are the big pharma companies, which outsource discovery to enhance the speed of their pipeline and get access to specialized technologies. CROs who are typically focused on this business area frequently find themselves contracted to deliver some full-service model (with the AI-driven target screening and preclinical validation) that shortens development schedules.
- Biotechnology Firms (Fastest-Growing): This instrumental client is the quickest-evolving, frequently an upstart firm with possibly groundbreaking forms, and however restricted internal capacities. They also rely on discovery outsourcing to obtain access to infrastructure, domain capabilities, and regulatory preparedness, which is usually niche or high-risk projects like rare diseases and emerging modalities.
- Academic and Research Institutes: Research hospitals, universities and academic research-based institutes play key roles in initial discoveries and partner with CROs in validation work. This sector is influential in translational science and commonly participates in grant-funded or co-development initiatives in a new mechanism or unmet need.
- Government & Public Sector: The government and state organizations as well as public research entities engage discovery services to undertake large-scale health projects. These are frequently programs of vaccine research and development, or antimicrobial resistance, or rare disease discovery, and these programs often are over a multi-year timeline, often funded publicly, such as in the NIH or the Horizon Europe programs.
Note: Charts and figures are illustrative only. Contact us for verified market data.
Segmentation By Region
Where the Market is Growing Fastest?
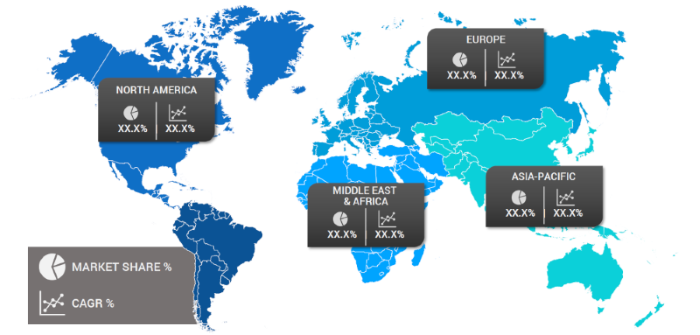
In regional terms, North America is the geographical leader of the Drug Discovery Services Market as it holds more than 45 percent market share owing to the concentration of biopharma companies and CROs. Europe is very close behind with its greatest strength in biologics and regulatory harmonization. In APAC, the region has been the fastest growing base due to the relatively low costs of operation, rising foreign investments, and the efforts by the government in India, South Korea, and China. Such geographical perspectives are an indicator that although North America continues to dominate, Asia-Pacific could provide rapid growth opportunities to service providers and investors.
The following nations and regions will be covered in the report:
• North America: U.S., Canada and Mexico
• Asia Pacific: China, India, Japan, South Korea, Australia, among others
• Europe: Germany, France, Italy, Spain, UK, Russia, Rest of Europe
• Latin America: Brazil, Argentina, Colombia
• Middle East & Africa: Saudi Arabia, UAE, South Africa, Israel, Turkey
Note: Charts and figures are illustrative only. Contact us for verified market data.
1. Drug Discovery Services Market: Market Introduction & Context
1.1. Market Definition
1.2. Scope of the Study
1.3. Research Methodology
1.3.1. Primary Data Collection
1.3.2. Secondary Data Sourcing
1.3.3. External Industry Collaborations
1.3.4. In-House Research Databases
1.3.5. Analytical Frameworks & Forecasting End-Users
1.3.6. Data Validation and Final Report Publishing
1.4. Key Assumptions
1.5. Market Ecosystem Overview
1.6. Stakeholder Analysis (Manufacturers, Suppliers, Growers, Distributors, Retailers)
(introduces the report’s scope, methodology, and assumptions to help the client clearly understand the study's coverage, data sources, and reliability)
2. Drug Discovery Services Market: Executive Summary
2.1. Key Insights & Market Snapshots
2.2. Analyst Viewpoint
2.3. Market Attractiveness Index
(offers a brief yet insightful market summary, giving the client a quick grasp of key trends, market potential, and strategic highlights)
3. Drug Discovery Services Market: Market Dynamics & Outlook
3.1. Drivers and their impact analysis
3.2. Restraints and their impact analysis
3.3. Opportunities and their impact analysis (Emerging Markets, New Product Categories)
3.4. Patent & Innovation Analysis (2020–2024)
(explains the major drivers, restraints, opportunities, and challenges shaping the market, enabling the client to assess both growth prospects and potential risks)
4. Drug Discovery Services Market: Market Environment & Industry
4.1. PESTEL Analysis
4.1.1. Political
4.1.2. Economic
4.1.3. Social
4.1.4. Technological
4.1.5. Environmental
4.1.6. Legal
4.2. Porter’s Five Forces Analysis
4.2.1. Threat of New Entrants
4.2.2. Bargaining Power of Buyers
4.2.3. Bargaining Power of Suppliers
4.2.4. Substitution Risk
4.2.5. Competitive Rivalry
4.3. Pricing Trend Analysis by Region (2024–2030)
4.4. Value Chain & Supply Chain Analysis
4.5. Impact of Digitalization
4.6. Service & Innovation Landscape
4.7. Regulatory Framework Analysis
4.7.1. Global & Regional Regulations
4.7.1.1. North America
4.7.1.2. Europe
4.7.1.3. APAC
4.7.1.4. LATAM
4.7.1.5. MEA
4.8. Import/Export Restrictions & Tariff Impact
4.9. Government Initiatives
4.10. Impact of Escalating Geopolitical Tensions
(provides an overview of the industry landscape, covering market dynamics, technological advancements, pricing trends, and regulatory influences for informed decision-making)
5. Drug Discovery Services Market – By Service
5.1. Overview
5.1.1. Segment Share Analysis, By Service, 2024 & 2035 (%)
5.1.2. Target Identification & Validation
5.1.3. Hit-to-Lead Identification
5.1.4. Lead Optimization
5.1.5. Candidate Selection & Preclinical Development
(presents market segmentation by Service, guiding the client on the product categories that are expected to drive demand and shape future revenue streams)
6. Drug Discovery Services Market – By Therapeutic Area
6.1. Overview
6.1.1. Segment Share Analysis, By Therapeutic Area, 2024 & 2035 (%)
6.1.2. Oncology
6.1.3. Neurology
6.1.4. Infectious Diseases
6.1.5. Immunology & Inflammation
6.1.6. Metabolic Disorders
6.1.7. Rare & Orphan Diseases
(breaks down the market by Therapeutic Area, assisting the client in identifying material or origin preferences and emerging growth segments)
7. Drug Discovery Services Market – By Molecule
7.1. Overview
7.1.1. Segment Share Analysis, By Molecule, 2024 & 2035 (%)
7.1.2. Small Molecule Drugs
7.1.3. Biologics
7.1.4. Gene & Cell Therapies
7.1.5. Antibody-Drug Conjugates (ADCs)
7.1.6. Oligonucleotides
(focuses on market segmentation by Molecule, helping the client prioritize specific crop Services or end-use areas that offer significant business opportunities)
8. Drug Discovery Services Market – By End-User
8.1. Overview
8.1.1. Segment Share Analysis, By End-User, 2024 & 2035 (%)
8.1.2. Pharmaceutical Companies
8.1.3. Biotechnology Firms
8.1.4. Academic & Research Institutes
8.1.5. Government & Public Sector
(describes the market division by End-User of Service, enabling the client to understand which usage methods are preferred and where future demand may rise)
9. Drug Discovery Services Market– By Geography
9.1. Introduction
9.1.1. Segment Share Analysis, By Geography, 2024 & 2035 (%)
9.2. North America
9.2.1. Regional Overview & Trends
9.2.2. Drug Discovery Services Key Manufacturers in North America
9.2.3. North America Market Size and Forecast, By Country, 2024 - 2035 (US$ Billion)
9.2.4. North America Market Size and Forecast, By Service, 2024 - 2035 (US$ Billion)
9.2.5. North America Market Size and Forecast, By Therapeutic Area, 2024 - 2035 (US$ Billion)
9.2.6. North America Market Size and Forecast, By Molecule, 2024 - 2035 (US$ Billion)
9.2.7. North America Market Size and Forecast, By End-User, 2024 - 2035 (US$ Billion)
9.2.8. U.S.
9.2.8.1. Overview
9.2.8.2. U.S. Market Size and Forecast, By Service, 2024 - 2035 (US$ Billion)
9.2.8.3. U.S. Market Size and Forecast, By Therapeutic Area, 2024 - 2035 (US$ Billion)
9.2.8.4. U.S. Market Size and Forecast, By Molecule, 2024 - 2035 (US$ Billion)
9.2.8.5. U.S. Market Size and Forecast, By End-User, 2024 - 2035 (US$ Billion)
9.2.9. Canada
9.2.9.1. Overview
9.2.9.2. Canada Market Size and Forecast, By Service, 2024 - 2035 (US$ Billion)
9.2.9.3. Canada Market Size and Forecast, By Therapeutic Area, 2024 - 2035 (US$ Billion)
9.2.9.4. Canada Market Size and Forecast, By Molecule, 2024 - 2035 (US$ Billion)
9.2.9.5. Canada Market Size and Forecast, By End-User, 2024 - 2035 (US$ Billion)
9.2.10. Mexico
9.2.10.1. Overview
9.2.10.2. Mexico Market Size and Forecast, By Service, 2024 - 2035 (US$ Billion)
9.2.10.3. Mexico Market Size and Forecast, By Therapeutic Area, 2024 - 2035 (US$ Billion)
9.2.10.4. Mexico Market Size and Forecast, By Molecule, 2024 - 2035 (US$ Billion)
9.2.10.5. Mexico Market Size and Forecast, By End-User, 2024 - 2035 (US$ Billion)
Note: Similar information and analysis will be provided for all other regions (Europe, APAC, LATAM and MEA) and countries listed in the subsequent sections.
9.3. Europe
9.3.1. Germany
9.3.2. Italy
9.3.3. United Kingdom
9.3.4. France
9.3.5. Russia
9.3.6. Poland
9.3.7. Rest of Europe
9.4. Asia Pacific (APAC)
9.4.1. India
9.4.2. China
9.4.3. Japan
9.4.4. South Korea
9.4.5. Australia
9.4.6. Rest of APAC
9.5. Latin America
9.5.1. Brazil
9.5.2. Argentina
9.5.3. Colombia
9.5.4. Rest of LATAM
9.6. Middle East and Africa
9.6.1. Israel
9.6.2. Turkey
9.6.3. Egypt
9.6.4. Rest of MEA
(delivers a detailed regional and country-level analysis, supporting the client in recognizing growth hotspots and strategically allocating resources across geographies)
10. Drug Discovery Services Market: Competitive Landscape & Company Profiles
10.1. Market Share Analysis (2024)
10.2. Company Positioning Matrix (Leaders, Innovators, Emerging Players)
10.3. Company Profiles (Key Players: Overview, Products, Strategies, Financials, Recent Developments)
10.3.1. Cerner (Oracle Health)
10.3.2. Epic Systems
10.3.3. Allscripts
10.3.4. Athenahealth
10.3.5. Meditech
10.3.6. Philips Healthcare
10.3.7. Siemens Healthineers
10.3.8. IBM Watson Health
10.3.9. Salesforce Health Cloud
10.3.10. Oracle Health (Cerner)
10.3.11. MyChart (by Epic)
10.3.12. GetWellNetwork
10.3.13. Grand Rounds
10.3.14. Welltok (HEALOW)
10.3.15. Teladoc Health
10.3.16. Others
Note: All company profiles will include details under the standard heads mentioned in section 10.3 - Overview, Products, Strategies, Financials, and Recent Developments. We also offer customization of the company profiling section based on your specific requirements.
(provides an assessment of key competitors, market shares, and strategic developments, giving the client essential insights to benchmark against or collaborate with industry leaders)
11. Drug Discovery Services Market: Future Market Outlook (2025–2035)
11.1.1. Scenario Analysis (Optimistic, Realistic, Pessimistic)
11.1.2. Disruptive Technologies Impact
11.1.3. Emerging Business Trends
11.1.4. Business Opportunities for startups and existing players
(presents market forecasts and future outlook scenarios, preparing the client for upcoming trends, innovations, and potential shifts in market structure)
12. Drug Discovery Services Market: Strategic Recommendations
(offers strategic recommendations for various stakeholders, enabling the client to make informed business decisions that maximize growth and minimize risks)
13. Drug Discovery Services Market: Disclaimer
(states the report’s disclaimers and legal boundaries, ensuring the client understands the terms of use, limitations, and responsibilities associated with the report)
List of Tables
TABLE 1: List of Data Sources
TABLE 2: Market Drivers; Impact Analysis
TABLE 3: Market Restraints; Impact Analysis
TABLE 4: Drug Discovery Services Market: Service Snapshot (2024)
TABLE 5: Segment Dashboard; Definition and Scope, by Service
TABLE 6: Global Drug Discovery Services Market, by Service 2022–2035 (USD Million)
TABLE 7: Drug Discovery Services Market: Therapeutic Area Snapshot (2024)
TABLE 8: Segment Dashboard; Definition and Scope, by Therapeutic Area
TABLE 9: Global Drug Discovery Services Market, by Therapeutic Area 2022–2035 (USD Million)
TABLE 10: Drug Discovery Services Market: Service Snapshot (2024)
TABLE 11: Segment Dashboard; Definition and Scope, by Molecule
TABLE 12: Global Drug Discovery Services Market, by Molecule 2022–2035 (USD Million)
TABLE 13: Drug Discovery Services Market: Service Snapshot (2024)
TABLE 14: Segment Dashboard; Definition and Scope, by End-User
TABLE 15: Global Drug Discovery Services Market, by End-User 2022–2035 (USD Million)
TABLE 16: Drug Discovery Services Market: Regional Snapshot (2024)
TABLE 17: Segment Dashboard; Definition and Scope, by Region
TABLE 18: Global Drug Discovery Services Market, by Region 2022–2035 (USD Million)
TABLE 19: Drug Discovery Services Market, by Country (NA), 2022–2035 (USD Million)
TABLE 20: Drug Discovery Services Market, by Service (NA), 2022–2035 (USD Million)
TABLE 21: Drug Discovery Services Market, by Therapeutic Area (NA), 2022–2035 (USD Million)
TABLE 22: Drug Discovery Services Market, by Molecule (NA), 2024–2035 (USD Million)
TABLE 23: Drug Discovery Services Market, by End-User (NA), 2022–2035 (USD Million)
TABLE 24: U.S. Drug Discovery Services Market, by Service, 2022–2035 (USD Million)
TABLE 25: U.S. Drug Discovery Services Market, by Therapeutic Area, 2022–2035 (USD Million)
TABLE 26: U.S. Drug Discovery Services Market, by Molecule, 2022–2035 (USD Million)
TABLE 27: U.S. Drug Discovery Services Market, by End-User, 2022–2035 (USD Million)
TABLE 28: Canada Drug Discovery Services Market, by Service, 2022–2035 (USD Million)
TABLE 29: Canada Drug Discovery Services Market, by Therapeutic Area, 2022–2035 (USD Million)
TABLE 30: Canada Drug Discovery Services Market, by Molecule, 2022–2035 (USD Million)
TABLE 31: Canada Drug Discovery Services Market, by End-User, 2022–2035 (USD Million)
TABLE 32: Mexico Drug Discovery Services Market, by Service, 2022–2035 (USD Million)
TABLE 33: Mexico Drug Discovery Services Market, by Therapeutic Area, 2022–2035 (USD Million)
TABLE 34: Mexico Drug Discovery Services Market, by Molecule, 2022–2035 (USD Million)
TABLE 35: Mexico Drug Discovery Services Market, by End-User, 2022–2035 (USD Million)
TABLE 36: Drug Discovery Services Market, by Country (Europe), 2022–2035 (USD Million)
TABLE 37: Drug Discovery Services Market, by Service (Europe), 2022–2035 (USD Million)
TABLE 38: Drug Discovery Services Market, by Therapeutic Area (Europe), 2022–2035 (USD Million)
TABLE 39: Drug Discovery Services Market, by Molecule (Europe), 2022–2035 (USD Million)
TABLE 40: Drug Discovery Services Market, by End-User (Europe), 2022–2035 (USD Million)
TABLE 41: Germany Drug Discovery Services Market, by Service, 2022–2035 (USD Million)
TABLE 42: Germany Drug Discovery Services Market, by Therapeutic Area, 2022–2035 (USD Million)
TABLE 43: Germany Drug Discovery Services Market, by Molecule, 2022–2035 (USD Million)
TABLE 44: Germany Drug Discovery Services Market, by End-User, 2022–2035 (USD Million)
TABLE 45: Italy Drug Discovery Services Market, by Service, 2022–2035 (USD Million)
TABLE 46: Italy Drug Discovery Services Market, by Therapeutic Area, 2022–2035 (USD Million)
TABLE 47: Italy Drug Discovery Services Market, by Molecule, 2022–2035 (USD Million)
TABLE 48: Italy Drug Discovery Services Market, by End-User, 2022–2035 (USD Million)
TABLE 49: United Kingdom Drug Discovery Services Market, by Service, 2022–2035 (USD Million)
TABLE 50: United Kingdom Drug Discovery Services Market, by Therapeutic Area, 2022–2035 (USD Million)
TABLE 51: United Kingdom Drug Discovery Services Market, by Molecule, 2022–2035 (USD Million)
TABLE 52: United Kingdom Drug Discovery Services Market, by End-User, 2022–2035 (USD Million)
TABLE 53: France Drug Discovery Services Market, by Service, 2022–2035 (USD Million)
TABLE 54: France Drug Discovery Services Market, by Therapeutic Area, 2022–2035 (USD Million)
TABLE 55: France Drug Discovery Services Market, by Molecule, 2022–2035 (USD Million)
TABLE 56: France Drug Discovery Services Market, by End-User, 2022–2035 (USD Million)
TABLE 57: Russia Drug Discovery Services Market, by Service, 2022–2035 (USD Million)
TABLE 58: Russia Drug Discovery Services Market, by Therapeutic Area, 2022–2035 (USD Million)
TABLE 59: Russia Drug Discovery Services Market, by Molecule, 2022–2035 (USD Million)
TABLE 60: Russia Drug Discovery Services Market, by End-User, 2022–2035 (USD Million)
TABLE 61: Poland Drug Discovery Services Market, by Service, 2022–2035 (USD Million)
TABLE 62: Poland Drug Discovery Services Market, by Therapeutic Area, 2022–2035 (USD Million)
TABLE 63: Poland Drug Discovery Services Market, by Molecule, 2022–2035 (USD Million)
TABLE 64: Poland Drug Discovery Services Market, by End-User, 2022–2035 (USD Million)
TABLE 65: Rest of Europe Drug Discovery Services Market, by Service, 2022–2035 (USD Million)
TABLE 66: Rest of Europe Drug Discovery Services Market, by Therapeutic Area, 2022–2035 (USD Million)
TABLE 67: Rest of Europe Drug Discovery Services Market, by Molecule, 2022–2035 (USD Million)
TABLE 68: Rest of Europe Drug Discovery Services Market, by End-User, 2022–2035 (USD Million)
TABLE 69: Drug Discovery Services Market, by Country (APAC), 2022–2035 (USD Million)
TABLE 70: Drug Discovery Services Market, by Service (APAC), 2022–2035 (USD Million)
TABLE 71: Drug Discovery Services Market, by Therapeutic Area (APAC), 2022–2035 (USD Million)
TABLE 72: Drug Discovery Services Market, by Molecule(APAC), 2022–2035 (USD Million)
TABLE 73: Drug Discovery Services Market, by End-User (APAC), 2022–2035 (USD Million)
TABLE 74: India Drug Discovery Services Market, by Service, 2022–2035 (USD Million)
TABLE 75: India Drug Discovery Services Market, by Therapeutic Area, 2022–2035 (USD Million)
TABLE 76: India Drug Discovery Services Market, by Molecule, 2022–2035 (USD Million)
TABLE 77: India Drug Discovery Services Market, by End-User, 2022–2035 (USD Million)
TABLE 78: China Drug Discovery Services Market, by Service, 2022–2035 (USD Million)
TABLE 79: China Drug Discovery Services Market, by Therapeutic Area, 2022–2035 (USD Million)
TABLE 80: China Drug Discovery Services Market, by Molecule, 2022–2035 (USD Million)
TABLE 81: China Drug Discovery Services Market, by End-User, 2022–2035 (USD Million)
TABLE 82: Japan Drug Discovery Services Market, by Service, 2022–2035 (USD Million)
TABLE 83: Japan Drug Discovery Services Market, by Therapeutic Area, 2022–2035 (USD Million)
TABLE 84: Japan Drug Discovery Services Market, by Molecule, 2022–2035 (USD Million)
TABLE 85: Japan Drug Discovery Services Market, by End-User, 2022–2035 (USD Million)
TABLE 86: South Korea Drug Discovery Services Market, by Service, 2022–2035 (USD Million)
TABLE 87: South Korea Drug Discovery Services Market, by Therapeutic Area, 2022–2035 (USD Million)
TABLE 88: South Korea Drug Discovery Services Market, by Molecule, 2022–2035 (USD Million)
TABLE 89: South Korea Drug Discovery Services Market, by End-User, 2022–2035 (USD Million)
TABLE 90: Australia Drug Discovery Services Market, by Service, 2022–2035 (USD Million)
TABLE 91: Australia Drug Discovery Services Market, by Therapeutic Area, 2022–2035 (USD Million)
TABLE 92: Australia Drug Discovery Services Market, by Molecule, 2022–2035 (USD Million)
TABLE 93: Australia Drug Discovery Services Market, by End-User, 2022–2035 (USD Million)
TABLE 94: Rest of APAC Drug Discovery Services Market, by Service, 2022–2035 (USD Million)
TABLE 95: Rest of APAC Drug Discovery Services Market, by Therapeutic Area, 2022–2035 (USD Million)
TABLE 96: Rest of APAC Drug Discovery Services Market, by Molecule, 2022–2035 (USD Million)
TABLE 97: Rest of APAC Drug Discovery Services Market, by End-User, 2022–2035 (USD Million)
TABLE 98: Brazil Drug Discovery Services Market, by Service, 2022–2035 (USD Million)
TABLE 99: Brazil Drug Discovery Services Market, by Therapeutic Area, 2022–2035 (USD Million)
TABLE 100: Brazil Drug Discovery Services Market, by Molecule, 2022–2035 (USD Million)
TABLE 101: Brazil Drug Discovery Services Market, by End-User, 2022–2035 (USD Million)
TABLE 102: Argentina Drug Discovery Services Market, by Service, 2022–2035 (USD Million)
TABLE 103: Argentina Drug Discovery Services Market, by Therapeutic Area, 2022–2035 (USD Million)
TABLE 104: Argentina Drug Discovery Services Market, by Molecule, 2022–2035 (USD Million)
TABLE 105: Argentina Drug Discovery Services Market, by End-User, 2022–2035 (USD Million)
TABLE 106: Colombia Drug Discovery Services Market, by Service, 2022–2035 (USD Million)
TABLE 107: Colombia Drug Discovery Services Market, by Therapeutic Area, 2022–2035 (USD Million)
TABLE 108: Colombia Drug Discovery Services Market, by Molecule, 2022–2035 (USD Million)
TABLE 109: Colombia Drug Discovery Services Market, by End-User, 2022–2035 (USD Million)
TABLE 110: Rest of LATAM Drug Discovery Services Market, by Service, 2022–2035 (USD Million)
TABLE 111: Rest of LATAM Drug Discovery Services Market, by Therapeutic Area, 2022–2035 (USD Million)
TABLE 112: Rest of LATAM Drug Discovery Services Market, by Molecule, 2022–2035 (USD Million)
TABLE 113: Rest of LATAM Drug Discovery Services Market, by End-User, 2022–2035 (USD Million)
TABLE 114: Israel Drug Discovery Services Market, by Service, 2022–2035 (USD Million)
TABLE 115: Israel Drug Discovery Services Market, by Therapeutic Area, 2022–2035 (USD Million)
TABLE 116: Israel Drug Discovery Services Market, by v, 2022–2035 (USD Million)
TABLE 117: Israel Drug Discovery Services Market, by End-User, 2022–2035 (USD Million)
TABLE 118: Turkey Drug Discovery Services Market, by Service, 2022–2035 (USD Million)
TABLE 119: Turkey Drug Discovery Services Market, by Therapeutic Area, 2022–2035 (USD Million)
TABLE 120: Turkey Drug Discovery Services Market, by Molecule, 2022–2035 (USD Million)
TABLE 121: Turkey Drug Discovery Services Market, by End-User, 2022–2035 (USD Million)
TABLE 122: Egypt Drug Discovery Services Market, by Service, 2022–2035 (USD Million)
TABLE 123: Egypt Drug Discovery Services Market, by Therapeutic Area, 2022–2035 (USD Million)
TABLE 124: Egypt Drug Discovery Services Market, by Molecule, 2022–2035 (USD Million)
TABLE 125: Egypt Drug Discovery Services Market, by End-User, 2022–2035 (USD Million)
TABLE 126: Rest of MEA Drug Discovery Services Market, by Service, 2022–2035 (USD Million)
TABLE 127: Rest of MEA Drug Discovery Services Market, by Therapeutic Area, 2022–2035 (USD Million)
TABLE 128: Rest of MEA Drug Discovery Services Market, by Molecule, 2022–2035 (USD Million)
TABLE 129: Rest of MEA Drug Discovery Services Market, by End-User, 2022–2035 (USD Million)
List of Figures
FIGURE 1: Drug Discovery Services Market Segmentation
FIGURE 2: Market Research Methodology
FIGURE 3: Value Chain Analysis
FIGURE 4: PESTLE Analysis
FIGURE 5: Porter’s Five Forces Analysis
FIGURE 6: Market Attractiveness Analysis
FIGURE 7: Market Dynamics
FIGURE 8: Innovation & Patent Landscape (2020–2024)
FIGURE 9: Competitive Landscape; Key Company Market Share Analysis, 2023
FIGURE 10: Service Segment Market Share Analysis, 2023 & 2035
FIGURE 11: Service Segment Market Size Forecast and Trend Analysis, 2024 to 2035 (USD Million)
FIGURE 12: Therapeutic Area Segment Market Share Analysis, 2023 & 2035
FIGURE 13: Therapeutic Area Segment Market Size Forecast and Trend Analysis, 2024 to 2035 (USD Million)
FIGURE 14: Molecule Segment Market Share Analysis, 2023 & 2035
FIGURE 15: Molecule Segment Market Size Forecast and Trend Analysis, 2024 to 2035 (USD Million)
FIGURE 16: End-User Segment Market Share Analysis, 2023 & 2035
FIGURE 17: End-User Segment Market Size Forecast and Trend Analysis, 2024 to 2035 (USD Million)
FIGURE 18: Regional Segment Market Share Analysis, 2023 & 2035
FIGURE 19: Regional Segment Market Size Forecast and Trend Analysis, 2024 to 2035 (USD Million)
FIGURE 20: North America Agricultural Biological Market Share and Leading Players, 2024
FIGURE 21: Europe Drug Discovery Services Market Share and Leading Players, 2024
FIGURE 22: Asia Pacific Drug Discovery Services Market Share and Leading Players, 2024
FIGURE 23: Latin America Drug Discovery Services Market Share and Leading Players, 2024
FIGURE 24: Middle East and Africa Drug Discovery Services Market Share and Leading Players, 2024
FIGURE 25: North America Market Share Analysis by Country, 2024
FIGURE 26: U.S. Drug Discovery Services Market Size, Forecast and Trend Analysis, 2024 to 2035 (USD Million)
FIGURE 27: Canada Drug Discovery Services Market Size, Forecast and Trend Analysis, 2024 to 2035 (USD Million)
FIGURE 28: Mexico Drug Discovery Services Market Size, Forecast and Trend Analysis, 2024 to 2035 (USD Million)
FIGURE 29: Europe Drug Discovery Services Market Share Analysis by Country, 2023
FIGURE 30: Germany Drug Discovery Services Market Size, Forecast and Trend Analysis, 2024 to 2035 (USD Million)
FIGURE 31: Spain Drug Discovery Services Market Size, Forecast and Trend Analysis, 2024 to 2035 (USD Million)
FIGURE 32: Italy Drug Discovery Services Market Size, Forecast and Trend Analysis, 2024 to 2035 (USD Million)
FIGURE 33: France Drug Discovery Services Market Size, Forecast and Trend Analysis, 2024 to 2035 (USD Million)
FIGURE 34: UK Drug Discovery Services Market Size, Forecast and Trend Analysis, 2024 to 2035 (USD Million)
FIGURE 35: Russia Drug Discovery Services Market Size, Forecast and Trend Analysis, 2024 to 2035 (USD Million)
FIGURE 36: Poland Drug Discovery Services Market Size, Forecast and Trend Analysis, 2024 to 2035 (USD Million)
FIGURE 37: Rest of Europe Drug Discovery Services Market Size, Forecast and Trend Analysis, 2024 to 2035 (USD Million)
FIGURE 38: Asia Pacific Drug Discovery Services Market Share Analysis by Country, 2023
FIGURE 39: India Drug Discovery Services Market Size, Forecast and Trend Analysis, 2024 to 2035 (USD Million)
FIGURE 40: China Drug Discovery Services Market Size, Forecast and Trend Analysis, 2024 to 2035 (USD Million)
FIGURE 41: Japan Drug Discovery Services Market Size, Forecast and Trend Analysis, 2024 to 2035 (USD Million)
FIGURE 42: South Korea Drug Discovery Services Market Size, Forecast and Trend Analysis, 2024 to 2035 (USD Million)
FIGURE 43: Australia Drug Discovery Services Market Size, Forecast and Trend Analysis, 2024 to 2035 (USD Million)
FIGURE 44: Rest of APAC Drug Discovery Services Market Size, Forecast and Trend Analysis, 2024 to 2035 (USD Million)
FIGURE 45: Latin America Drug Discovery Services Market Size, Forecast and Trend Analysis, 2024 to 2035 (USD Million)
FIGURE 46: Latin America Drug Discovery Services Market Share Analysis by Country, 2023
FIGURE 47: Brazil Drug Discovery Services Market Size, Forecast and Trend Analysis, 2024 to 2035 (USD Million)
FIGURE 48: Argentina Drug Discovery Services Market Size, Forecast and Trend Analysis, 2024 to 2035 (USD Million)
FIGURE 49: Colombia Drug Discovery Services Market Size, Forecast and Trend Analysis, 2024 to 2035 (USD Million)
FIGURE 50: Rest of LATAM Drug Discovery Services Market Size, Forecast and Trend Analysis, 2024 to 2035 (USD Million)
FIGURE 51: Middle East and Africa Drug Discovery Services Market Size, Forecast and Trend Analysis, 2024 to 2035 (USD Million)
FIGURE 52: Middle East and Africa Drug Discovery Services Market Share Analysis by Country, 2023
FIGURE 53: GCC Countries (Saudi Arabia, UAE, Qatar, Kuwait, Oman, Bahrain) Drug Discovery Services Market Size, Forecast and Trend Analysis, 2024 to 2035 (USD Million)
FIGURE 54: Israel Drug Discovery Services Market Size, Forecast and Trend Analysis, 2024 to 2035 (USD Million)
FIGURE 55: Turkey Drug Discovery Services Market Size, Forecast and Trend Analysis, 2024 to 2035 (USD Million)
FIGURE 56: Egypt Drug Discovery Services Market Size, Forecast and Trend Analysis, 2024 to 2035 (USD Million)
FIGURE 57: Rest of MEA Drug Discovery Services Market Size, Forecast and Trend Analysis, 2024 to 2035 (USD Million)
- "This report offered far more than just market numbers. It gave us strategic visibility into the evolving CRO landscape and helped our team reevaluate outsourcing partnerships across hit-to-lead and lead optimization stages. The comparative vendor analysis, regional capacity assessments, and therapeutic area breakdowns directly supported our 2025 pipeline planning and budget realignment. The depth of primary insights made this a highly reliable resource for our decision-making."
- Jonathan Reed, Head of Preclinical R&D, Mid-sized Biopharma (USA)
- "We’ve reviewed multiple syndicated studies in this space, but few match the analytical clarity of the Drug Discovery Services Market Research Report by Quants & Trends. The report’s segmentation by service type and drug modality, especially around small molecules and biologics, was precisely what we needed to guide our vendor selection process across the EU. It also helped us align with new partners in emerging therapeutic areas. The credibility of the research team is evident throughout."
- Sofia Lundgren, Director of External Innovation, Drug Development Consortium (Sweden)
- "We were conducting due diligence on a potential acquisition in the early-stage drug discovery CRO space, and this report played a key role in our evaluation. The regional market dynamics in Asia-Pacific, the IP-sharing models, and detailed trend mapping across oncology and CNS research made this study invaluable. It’s clear the authors have extensive domain knowledge and understand both scientific and commercial aspects of the value chain."
- Dr. Haruto Sakamoto, Senior Strategy Analyst, Life Sciences Investment Group (Japan)
The Drug Discovery Services Market 2025 report is authored by the healthcare research team at Quants & Trends, a trusted intelligence partner to global pharma, biotech firms, and contract research organizations (CROs). With over a decade of experience tracking the evolution of outsourced R&D models, therapeutic pipelines, and preclinical innovation strategies, our analysts bring unmatched depth and precision to this critical domain.
Our team is composed of senior market analysts, former pharma strategy consultants, and life science domain experts who have worked across the drug development value chain, from target identification and assay development to IND-enabling studies. This report draws on extensive primary interviews with decision-makers at CROs, biopharma innovation leads, and therapeutic program managers, along with proprietary forecasting models and competitive landscape tracking.
By offering detailed segmentation by service type, drug modality, therapeutic area, and outsourcing model, this report empowers decision-makers to navigate an increasingly specialized and globalized market. Whether you're a biopharma executive optimizing external R&D spending, a venture partner exploring investment in discovery CROs, or a strategy head planning pipeline expansion, this report delivers critical insights for confident and data-backed business decisions.
To learn more about our research methodology, data sources, and the experts behind our analysis, visit our official LinkedIn page and connect with our team.