Market Outlook
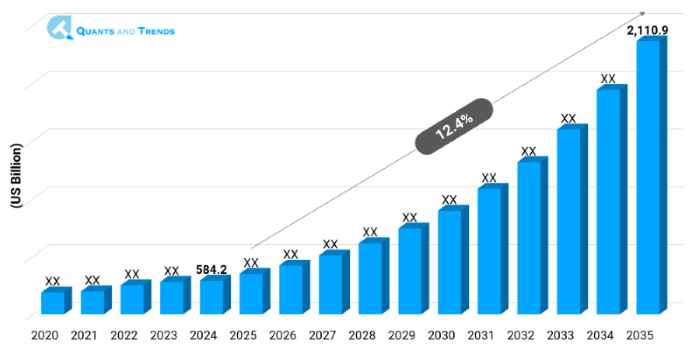
The global Pharmaceutical Manufacturing market was valued at approximately USD 584.2 billion in 2024 and is projected to grow at a compound annual growth rate (CAGR) of 12.4% from 2025 to 2035, reaching around USD 2,110.9 billion by the end of the forecast period. The historical analysis starts from 2020 to 2023 with 2024 as the base year and forecasts starts from 2025 to 2035.
The Pharmaceutical Manufacturing Market is on the verge of rapid growth under the influence of demographic changes, rising rates of chronic diseases, and worldwide demand of biologics and custom treatments. In its Pharmaceutical Manufacturing Market Forecast, industry analysts anticipate continued growth until 2035 driven by digitalization, convergence of regulations and contract manufacturing off-take. The industry players are investing heavily in automation, continuous manufacturing method and capacity to match with current demand. The dynamics of this market are driven by the emerging Key Trends in Pharmaceutical Manufacturing, which denote the focus on agility of supply value chains and modular facility models that improve the efficiency and flexibility.
| Base Year | 2024 |
|---|---|
| Forecast Period | 2025-2035 |
| Historical Period | 2020-2023 |
| CAGR | 12.4% |
| Market Value In 2024 | USD 584.2 billion |
| Market Value In 2035 | USD 2,110.9 billion |
Introduction
The report Pharmaceutical Manufacturing Market provides a holistic view on modern drug manufacturing industry involving small molecules, biologics, vaccines, and personalized medicine. It encompasses an end-to-end function including API production, formulation, aseptic filling and packaging. The report concerns itself with key industry trends, competitive positioning and technological adoption through Pharmaceutical Manufacturing Market Size & Share. It uses Pharmaceutical Manufacturing Industry Analysis to note change in manufacturing patterns comprising CMOs/SMOs and in-sourcing. Under the Technology Adoption of the Pharmaceutical manufacturing sector, the report highlights the presence opportunities on modernization, capacity rationalization, and internationalization in the ecosystem.
Key Market Drivers: What’s Fueling the Pharmaceutical Manufacturing Market Boom?
- Increased Demand of Biologics and Personalized Medicines: The current environment in pharmaceuticals is quickly moving towards biologics, cell & gene therapies and targeted therapies. Such complex molecules must be produced using special manufacturing technology-including single-use bioreactor, sterile filtration and cold-chain logistics. Outsourced capacity and investment in infrastructure are accelerating due to the increasing biologics segment, which becomes one of Pharmaceutical Manufacturing Investment Opportunities. This tendency is in line with the Market Dynamics, according to which personalization and scalability supersede the traditional batch processing.
- Implementation of Advanced Technologies in Manufacturing: Automate, continuous manufacturing of products, and Industry 4.0 platforms are transforming the line of production. Real-time visualization, foreseeable maintenance, freedom of batch sizes are available through technology, which saves garbage and speeds up production. Combining Quality by Design (QbD) and process analytical technology (PAT) with digital twins improves control and regulations. Such changes are indicative of Pharmaceutical Manufacturing Growth Drivers & Challenges, as companies are pouring money into the modernization as well as dealing with complexities of validation.
- Irrepressible Contract Manufacturing and Outsourcing: Pharmaceutical companies are discovering that using pharmaceutical CDMOs helps them to continue concentrating on research and development and allow them to expand in an efficient way. The expanses in contract services have flexibility in costs, compliance knowhow, and geographic coverage. This model is especially appealing to specialty pharma and mid-sized pharma companies and lowers the time to market and cash outlay. Development of the CDMO industry is key in Pharmaceutical Manufacturing Competitive Landscape, redefining supply chains and ways of working together.
Note: Charts and figures are illustrative only. Contact us for verified market data.
Innovation in Focus: How Manufacturers Are Raising the Bar?
Modular micro-factories, AI-enabled process control, continuous bioprocessing and digital twins drive innovation in the Pharmaceutical Manufacturing Market. Single-use flexible lines are being tested by companies to enable a quick change in products and capacity increase on a worldwide basis. New market participants incorporate digital solutions to predictive QC analytics and chain of origin. Such advances in technology are creating leaner production, quicker validation times and better regulatory adherence and has created a paradigm shift in the manufacturing and scaling of pharmaceuticals.
Recent Developments:
Lonza opened a new cell & gene cellular manufacturing facility in Singapore to produce cell & gene therapies in May 2025 enhancing Pharmaceutical Manufacturing Investment Opportunities.
In April 2025, Catalent announced acquiring a single-use bioprocessing technology provider to expand flexible biologics capacity to deploy modular manufacturing.
Conclusion
In conclusion, the Pharmaceutical Manufacturing Market is shifting towards leaving behind the legacy of the batch-driven systems to the agile, biologics-based, and digitally empowered ones. The core parts containing small molecule batch API manufactures and internal manufacturing facilities exist along with the more rapidly expanding sub-segments within the field of biologics, CDMO outsourcing, and continuous processes. In the geographical sphere, North America still lags ahead, and Asia-Pacific is providing interesting growth prospects. The report by Pharmaceutical Manufacturing highlights the criticalities of technology, coordination, and elastic capacity to serve the demand in future. Builders and financial investors are advised to concentrate on modular infrastructure, coordination of regulatory matters, and precise medications to take advantage of the new momentum.
Related Reports
- The global Pharmaceutical Industry Market size was valued at USD 1,640.5 billion in 2024 and is expected to reach around USD 2,900.5 billion by 2035, growing at a CAGR of 6% from 2025 to 2035.
- The global Healthcare Supply Chain Management Market was valued at approximately USD 3.65 billion in 2024 and is projected to grow at a compound annual growth rate (CAGR) of 6.9% from 2025 to 2035, reaching around USD 7.57 billion by the end of the forecast period.
Key Market Players
The Pharmaceutical Manufacturing Competitive Landscape entails a conglomeration of fully integrated pharmaceutical giants that have in-house manufacturing capacity and multinationals CDMO providers globally. Leaders like Lonza, Catalent, Thermo Fisher Scientific and Samsung Biologics are providing end-to-end biologics and small molecule production. Continuous manufacturing and single-use platforms are offered by mid-size regional CDMOs and by niche biotech process experts. Competitors are also increasing due to M&A, partnership, and co-investment models to increase the footprint and technology embracement in the Pharmaceutical Manufacturing Industry Analysis. Some of the key players in the Pharmaceutical Manufacturing industry are as:
Thermo Fisher Scientific, Lonza, Catalent, Samsung Biologics, Boehringer Ingelheim (CMO), Recipharm, Jubilant Biosys, Patheon, Wuxi Biologics, Piramal Pharma Solutions, Fujifilm Diosynth Biotechnologies, Siegfried Holding AG, AGC Biologics, AMRI (Albany Molecular Research Inc.), Aenova Group
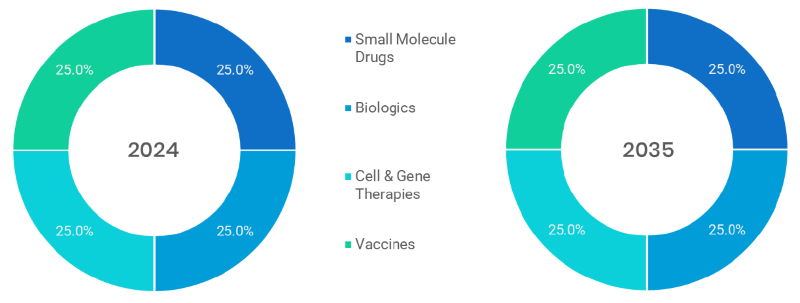
- Small Molecule Drugs (Dominating): This is the domain of chemically made, small size low molecular weight molecules that produce the biggest volumes globally because they have fully developed pipelines, can be scaled and have developed familiarity with regulatory agencies. They can treat a broad variety of conditions and they are cheaper to manufacture, transport, and store as compared to biologics.
- Biologics (Fastest-Growing): These are made of living agents and they are monoclonal antibodies and recombinant proteins. This division is on a fast growth path due to the presence of personalized medicine, chronic disease incidences as well as the effectiveness of biosimilars and immunotherapies which need extremely specific manufacturing plants.
- Cell & Gene Therapies: It is one of the advanced therapies that modifies the use of cells or genetic material to cure an illness or treat a disease. Although it is niche, it is the fastest-growing segment owing to the FDA clearances and the increase in demand of regenerative and curative therapies, particularly the rare genetic disorders.
- Vaccines: Vaccines have been back in the spotlight since the COVID-19. Scale manufacturing is currently taking place with both traditional and innovative (mRNA) vaccines, and large aseptic production capacities, as well as global distribution plans, are needed in order to achieve national coverage purposes of immunization and pandemic preparedness.
Note: Charts and figures are illustrative only. Contact us for verified market data.
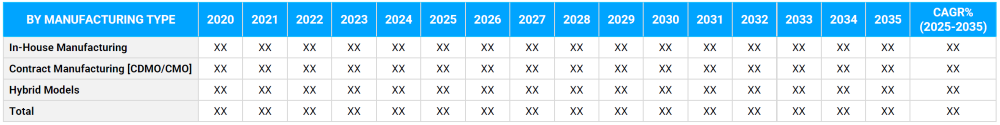
- In-House Manufacturing (Dominating): Major pharma corporations have in-house production to ensure maximum control of intellectual rights, quality and schedule. It is expensive, but guarantees compliance and integration in R&D, clinical trial and commercial, scale-up, which is critical in blockbuster drugs.
- Contract Manufacturing (CDMO/CMO) (Fastest-Growing): This is a rapidly expanding unit that offers contract formulation, development, and commercial generations processes. The scalability, cost-effectiveness and regulatory know-how CDMOs provide are also attractive to small companies or when suddenly needed to produce enormous quantities of vaccines, biologics and specialty injectables.
- Hybrid Model: The mixed approaches that are adopted include the firms maintaining key production processes whilst handing over non-core production or production with high volumes. Hybrid models provide flexibility in terms of operation, de-risk their capacity limits, and enable them to expand more quickly worldwide and without incurring incredibly huge capital expenditure.
Note: Charts and figures are illustrative only. Contact us for verified market data.
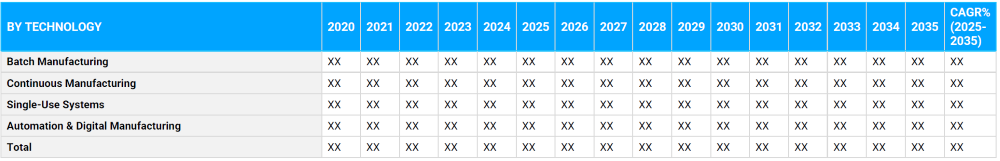
- Batch Manufacturing (Dominating): Batch manufacturing has been the common accepted norm over the past several decades and in general such manufacturing is economical and reliable on most small molecule and generic products. It is still in a leading position and has a bottleneck in terms of speed and complex or individualized therapies.
- Continuous Manufacturing (Fastest-Growing): Continuous manufacturing also including real-time quality control, occupies a smaller footprint, and is more efficient, and its regulatory acceptance is likewise taking root. It has been particularly useful with high-volume and high-quality pharmaceuticals and used with limited oral solids and biologics.
- Single-Use Systems: No longer considered cutting edge, but highly called upon in biologics manufacture, these disposable bioreactors and systems minimize the risk of contamination, increase speed and cut down cleaning validations. They also favour modular facilities and are preferred in the multi-product and flexible manufacturing environments.
- Automation and Digital Manufacturing: Artificial intelligence, robotics, IoT and digital twins are used to increase accuracy, minimize downtimes, and introduce predictive analytics. GMP, lean manufacturing and real-time decisions in complex multi-stage manufacturing require automation.
Note: Charts and figures are illustrative only. Contact us for verified market data.
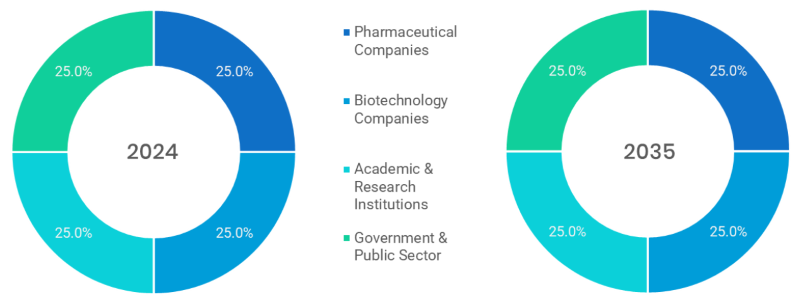
- Pharmaceutical Companies (Dominating): Controlling the end users, large pharma companies are involved in the whole cycle manufacturing that includes R&D and commercial launch. This is characterized by their investments in futuristic plants, digitalization and alignment with strategic CDMO relations that characterize the production environment globally.
- Biotechnology Firms (Fastest-Growing): The rapid increase in the need of the biotechnology firms is owing to their lack of infrastructure but innovative pipes. They depend on CDMOs a lot with respect to clinical-stage (and also early commercial) manufacturing, particularly of biologics, gene therapies, and niche therapies.
- Academic and Research Institution: It maintains preclinical-scale production and technological ideas. They regularly serve as partners on pilot-projects, proof-of-concept manufacturing, and early development of novel processes, especially in rare or orphan drug programs.
- Government & Public Sector: Governments seek manufacturing partners to pursue national healthcare priorities including vaccines, essentials generics and pandemic preparedness. Facility upgrades, technology transfer programs and emergency stockpiling activities are financed through public-private partnerships.
Note: Charts and figures are illustrative only. Contact us for verified market data.
Segmentation By Region
Where the Market is Growing Fastest?
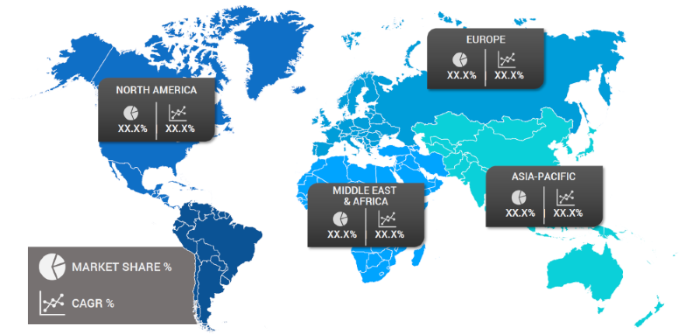
In regional terms, North America leads the Pharmaceutical Manufacturing Market as the most innovative, outstanding, and regulatory-friendly nation. The APAC, especially China and India, is the most fast-developing, driven by cost-effective CDMOs, an increasing healthcare infrastructure and beneficial government policies. Europe is doing well as there is good biologics and regulation in the harmonization of countries. These Regional Insights depict where opportunities and production increases are focused, dynamic development lines in Asia-Pacific and certain dominance in North America.
The following nations and regions will be covered in the report:
• North America: U.S., Canada and Mexico
• Asia Pacific: China, India, Japan, South Korea, Australia, among others
• Europe: Germany, France, Italy, Spain, UK, Russia, Rest of Europe
• Latin America: Brazil, Argentina, Colombia
• Middle East & Africa: Saudi Arabia, UAE, South Africa, Israel, Turkey
Note: Charts and figures are illustrative only. Contact us for verified market data.
1. Pharmaceutical Manufacturing Market: Market Introduction & Context
1.1. Market Definition
1.2. Scope of the Study
1.3. Research Methodology
1.3.1. Primary Data Collection
1.3.2. Secondary Data Sourcing
1.3.3. External Industry Collaborations
1.3.4. In-House Research Databases
1.3.5. Analytical Frameworks & Forecasting End-Users
1.3.6. Data Validation and Final Report Publishing
1.4. Key Assumptions
1.5. Market Ecosystem Overview
1.6. Stakeholder Analysis (Manufacturers, Suppliers, Growers, Distributors, Retailers)
(introduces the report’s scope, methodology, and assumptions to help the client clearly understand the study's coverage, data sources, and reliability)
2. Pharmaceutical Manufacturing Market: Executive Summary
2.1. Key Insights & Market Snapshots
2.2. Analyst Viewpoint
2.3. Market Attractiveness Index
(offers a brief yet insightful market summary, giving the client a quick grasp of key trends, market potential, and strategic highlights)
3. Pharmaceutical Manufacturing Market: Market Dynamics & Outlook
3.1. Drivers and their impact analysis
3.2. Restraints and their impact analysis
3.3. Opportunities and their impact analysis (Emerging Markets, New Product Categories)
3.4. Patent & Innovation Analysis (2020–2024)
(explains the major drivers, restraints, opportunities, and challenges shaping the market, enabling the client to assess both growth prospects and potential risks)
4. Pharmaceutical Manufacturing Market: Market Environment & Industry
4.1. PESTEL Analysis
4.1.1. Political
4.1.2. Economic
4.1.3. Social
4.1.4. Technological
4.1.5. Environmental
4.1.6. Legal
4.2. Porter’s Five Forces Analysis
4.2.1. Threat of New Entrants
4.2.2. Bargaining Power of Buyers
4.2.3. Bargaining Power of Suppliers
4.2.4. Substitution Risk
4.2.5. Competitive Rivalry
4.3. Pricing Trend Analysis by Region (2024–2030)
4.4. Value Chain & Supply Chain Analysis
4.5. Impact of Digitalization
4.6. Drug Type & Innovation Landscape
4.7. Regulatory Framework Analysis
4.7.1. Global & Regional Regulations
4.7.1.1. North America
4.7.1.2. Europe
4.7.1.3. APAC
4.7.1.4. LATAM
4.7.1.5. MEA
4.8. Import/Export Restrictions & Tariff Impact
4.9. Government Initiatives
4.10. Impact of Escalating Geopolitical Tensions
(provides an overview of the industry landscape, covering market dynamics, technological advancements, pricing trends, and regulatory influences for informed decision-making)
5. Pharmaceutical Manufacturing Market – By Drug Type
5.1. Overview
5.1.1. Segment Share Analysis, By Drug Type, 2024 & 2035 (%)
5.1.2. Small Technology Drugs
5.1.3. Biologics
5.1.4. Cell & Gene Therapies
5.1.5. Vaccines
(presents market segmentation by Drug Type, guiding the client on the product categories that are expected to drive demand and shape future revenue streams)
6. Pharmaceutical Manufacturing Market – By Manufacturing Type
6.1. Overview
6.1.1. Segment Share Analysis, By Manufacturing Type, 2024 & 2035 (%)
6.1.2. In-House Manufacturing
6.1.3. Contract Manufacturing [CDMO/CMO]
6.1.4. Hybrid Models
(breaks down the market by Manufacturing Type, assisting the client in identifying material or origin preferences and emerging growth segments)
7. Pharmaceutical Manufacturing Market – By Technology
7.1. Overview
7.1.1. Segment Share Analysis, By Technology, 2024 & 2035 (%)
7.1.2. Batch Manufacturing
7.1.3. Continuous Manufacturing
7.1.4. Single-Use Systems
7.1.5. Automation & Digital Manufacturing
(focuses on market segmentation by Technology, helping the client prioritize specific crop Drug Types or end-use areas that offer significant business opportunities)
8. Pharmaceutical Manufacturing Market – By End-User
8.1. Overview
8.1.1. Segment Share Analysis, By End-User, 2024 & 2035 (%)
8.1.2. Pharmaceutical Companies
8.1.3. Biotechnology Companies
8.1.4. Academic & Research Institutions
8.1.5. Government & Public Sector
(describes the market division by End-User of Drug Type, enabling the client to understand which usage methods are preferred and where future demand may rise)
9. Pharmaceutical Manufacturing Market– By Geography
9.1. Introduction
9.1.1. Segment Share Analysis, By Geography, 2024 & 2035 (%)
9.2. North America
9.2.1. Regional Overview & Trends
9.2.2. Pharmaceutical Manufacturing Key Manufacturers in North America
9.2.3. North America Market Size and Forecast, By Country, 2024 - 2035 (US$ Million)
9.2.4. North America Market Size and Forecast, By Drug Type, 2024 - 2035 (US$ Million)
9.2.5. North America Market Size and Forecast, By Manufacturing Type, 2024 - 2035 (US$ Million)
9.2.6. North America Market Size and Forecast, By Drug Type, 2024 - 2035 (US$ Million)
9.2.7. North America Market Size and Forecast, By End-User, 2024 - 2035 (US$ Million)
9.2.8. U.S.
9.2.8.1. Overview
9.2.8.2. U.S. Market Size and Forecast, By Drug Type, 2024 - 2035 (US$ Million)
9.2.8.3. U.S. Market Size and Forecast, By Manufacturing Type, 2024 - 2035 (US$ Million)
9.2.8.4. U.S. Market Size and Forecast, By Drug Type, 2024 - 2035 (US$ Million)
9.2.8.5. U.S. Market Size and Forecast, By End-User, 2024 - 2035 (US$ Million)
9.2.9. Canada
9.2.9.1. Overview
9.2.9.2. Canada Market Size and Forecast, By Drug Type, 2024 - 2035 (US$ Million)
9.2.9.3. Canada Market Size and Forecast, By Manufacturing Type, 2024 - 2035 (US$ Million)
9.2.9.4. Canada Market Size and Forecast, By Drug Type, 2024 - 2035 (US$ Million)
9.2.9.5. Canada Market Size and Forecast, By End-User, 2024 - 2035 (US$ Million)
9.2.10. Mexico
9.2.10.1. Overview
9.2.10.2. Mexico Market Size and Forecast, By Drug Type, 2024 - 2035 (US$ Million)
9.2.10.3. Mexico Market Size and Forecast, By Manufacturing Type, 2024 - 2035 (US$ Million)
9.2.10.4. Mexico Market Size and Forecast, By Drug Type, 2024 - 2035 (US$ Million)
9.2.10.5. Mexico Market Size and Forecast, By End-User, 2024 - 2035 (US$ Million)
Note: Similar information and analysis will be provided for all other regions (Europe, APAC, LATAM and MEA) and countries listed in the subsequent sections.
9.3. Europe
9.3.1. Germany
9.3.2. Italy
9.3.3. United Kingdom
9.3.4. France
9.3.5. Russia
9.3.6. Poland
9.3.7. Rest of Europe
9.4. Asia Pacific (APAC)
9.4.1. India
9.4.2. China
9.4.3. Japan
9.4.4. South Korea
9.4.5. Australia
9.4.6. Rest of APAC
9.5. Latin America
9.5.1. Brazil
9.5.2. Argentina
9.5.3. Colombia
9.5.4. Rest of LATAM
9.6. Middle East and Africa
9.6.1. Israel
9.6.2. Turkey
9.6.3. Egypt
9.6.4. Rest of MEA
(delivers a detailed regional and country-level analysis, supporting the client in recognizing growth hotspots and strategically allocating resources across geographies)
10. Pharmaceutical Manufacturing Market: Competitive Landscape & Company Profiles
10.1. Market Share Analysis (2024)
10.2. Company Positioning Matrix (Leaders, Innovators, Emerging Players)
10.3. Company Profiles (Key Players: Overview, Products, Strategies, Financials, Recent Developments)
10.3.1. Thermo Fisher Scientific
10.3.2. Lonza
10.3.3. Catalent
10.3.4. Samsung Biologics
10.3.5. Boehringer Ingelheim (CMO)
10.3.6. Recipharm
10.3.7. Jubilant Biosys
10.3.8. Patheon
10.3.9. Wuxi Biologics
10.3.10. Piramal Pharma Solutions
10.3.11. Fujifilm Diosynth Biotechnologies
10.3.12. Siegfried Holding AG
10.3.13. AGC Biologics
10.3.14. AMRI (Albany Molecular Research Inc.)
10.3.15. Aenova Group
10.3.16. Others
Note: All company profiles will include details under the standard heads mentioned in section 10.3 - Overview, Products, Strategies, Financials, and Recent Developments. We also offer customization of the company profiling section based on your specific requirements.
(provides an assessment of key competitors, market shares, and strategic developments, giving the client essential insights to benchmark against or collaborate with industry leaders)
11. Pharmaceutical Manufacturing Market: Future Market Outlook (2025–2035)
11.1.1. Scenario Analysis (Optimistic, Realistic, Pessimistic)
11.1.2. Disruptive Technologies Impact
11.1.3. Emerging Business Trends
11.1.4. Business Opportunities for startups and existing players
(presents market forecasts and future outlook scenarios, preparing the client for upcoming trends, innovations, and potential shifts in market structure)
12. Pharmaceutical Manufacturing Market: Strategic Recommendations
(offers strategic recommendations for various stakeholders, enabling the client to make informed business decisions that maximize growth and minimize risks)
13. Pharmaceutical Manufacturing Market: Disclaimer
(states the report’s disclaimers and legal boundaries, ensuring the client understands the terms of use, limitations, and responsibilities associated with the report)
List of Tables
TABLE 1: List of Data Sources
TABLE 2: Market Drivers; Impact Analysis
TABLE 3: Market Restraints; Impact Analysis
TABLE 4: Pharmaceutical Manufacturing Market: Drug Type Snapshot (2024)
TABLE 5: Segment Dashboard; Definition and Scope, by Drug Type
TABLE 6: Global Pharmaceutical Manufacturing Market, by Drug Type 2022–2035 (USD Million)
TABLE 7: Pharmaceutical Manufacturing Market: Manufacturing Type Snapshot (2024)
TABLE 8: Segment Dashboard; Definition and Scope, by Manufacturing Type
TABLE 9: Global Pharmaceutical Manufacturing Market, by Manufacturing Type 2022–2035 (USD Million)
TABLE 10: Pharmaceutical Manufacturing Market: Drug Type Snapshot (2024)
TABLE 11: Segment Dashboard; Definition and Scope, by Drug Type
TABLE 12: Global Pharmaceutical Manufacturing Market, by Drug Type 2022–2035 (USD Million)
TABLE 13: Pharmaceutical Manufacturing Market: Drug Type Snapshot (2024)
TABLE 14: Segment Dashboard; Definition and Scope, by End-User
TABLE 15: Global Pharmaceutical Manufacturing Market, by End-User 2022–2035 (USD Million)
TABLE 16: Pharmaceutical Manufacturing Market: Regional Snapshot (2024)
TABLE 17: Segment Dashboard; Definition and Scope, by Region
TABLE 18: Global Pharmaceutical Manufacturing Market, by Region 2022–2035 (USD Million)
TABLE 19: Pharmaceutical Manufacturing Market, by Country (NA), 2022–2035 (USD Million)
TABLE 20: Pharmaceutical Manufacturing Market, by Drug Type (NA), 2022–2035 (USD Million)
TABLE 21: Pharmaceutical Manufacturing Market, by Manufacturing Type (NA), 2022–2035 (USD Million)
TABLE 22: Pharmaceutical Manufacturing Market, by Technology (NA), 2024–2035 (USD Million)
TABLE 23: Pharmaceutical Manufacturing Market, by End-User (NA), 2022–2035 (USD Million)
TABLE 24: U.S. Pharmaceutical Manufacturing Market, by Drug Type, 2022–2035 (USD Million)
TABLE 25: U.S. Pharmaceutical Manufacturing Market, by Manufacturing Type, 2022–2035 (USD Million)
TABLE 26: U.S. Pharmaceutical Manufacturing Market, by Technology, 2022–2035 (USD Million)
TABLE 27: U.S. Pharmaceutical Manufacturing Market, by End-User, 2022–2035 (USD Million)
TABLE 28: Canada Pharmaceutical Manufacturing Market, by Drug Type, 2022–2035 (USD Million)
TABLE 29: Canada Pharmaceutical Manufacturing Market, by Manufacturing Type, 2022–2035 (USD Million)
TABLE 30: Canada Pharmaceutical Manufacturing Market, by Technology, 2022–2035 (USD Million)
TABLE 31: Canada Pharmaceutical Manufacturing Market, by End-User, 2022–2035 (USD Million)
TABLE 32: Mexico Pharmaceutical Manufacturing Market, by Drug Type, 2022–2035 (USD Million)
TABLE 33: Mexico Pharmaceutical Manufacturing Market, by Manufacturing Type, 2022–2035 (USD Million)
TABLE 34: Mexico Pharmaceutical Manufacturing Market, by Technology, 2022–2035 (USD Million)
TABLE 35: Mexico Pharmaceutical Manufacturing Market, by End-User, 2022–2035 (USD Million)
TABLE 36: Pharmaceutical Manufacturing Market, by Country (Europe), 2022–2035 (USD Million)
TABLE 37: Pharmaceutical Manufacturing Market, by Drug Type (Europe), 2022–2035 (USD Million)
TABLE 38: Pharmaceutical Manufacturing Market, by Manufacturing Type (Europe), 2022–2035 (USD Million)
TABLE 39: Pharmaceutical Manufacturing Market, by Technology(Europe), 2022–2035 (USD Million)
TABLE 40: Pharmaceutical Manufacturing Market, by End-User (Europe), 2022–2035 (USD Million)
TABLE 41: Germany Pharmaceutical Manufacturing Market, by Drug Type, 2022–2035 (USD Million)
TABLE 42: Germany Pharmaceutical Manufacturing Market, by Manufacturing Type, 2022–2035 (USD Million)
TABLE 43: Germany Pharmaceutical Manufacturing Market, by v, 2022–2035 (USD Million)
TABLE 44: Germany Pharmaceutical Manufacturing Market, by End-User, 2022–2035 (USD Million)
TABLE 45: Italy Pharmaceutical Manufacturing Market, by Drug Type, 2022–2035 (USD Million)
TABLE 46: Italy Pharmaceutical Manufacturing Market, by Manufacturing Type, 2022–2035 (USD Million)
TABLE 47: Italy Pharmaceutical Manufacturing Market, by Technology, 2022–2035 (USD Million)
TABLE 48: Italy Pharmaceutical Manufacturing Market, by End-User, 2022–2035 (USD Million)
TABLE 49: United Kingdom Pharmaceutical Manufacturing Market, by Drug Type, 2022–2035 (USD Million)
TABLE 50: United Kingdom Pharmaceutical Manufacturing Market, by Manufacturing Type, 2022–2035 (USD Million)
TABLE 51: United Kingdom Pharmaceutical Manufacturing Market, by Technology, 2022–2035 (USD Million)
TABLE 52: United Kingdom Pharmaceutical Manufacturing Market, by End-User, 2022–2035 (USD Million)
TABLE 53: France Pharmaceutical Manufacturing Market, by Drug Type, 2022–2035 (USD Million)
TABLE 54: France Pharmaceutical Manufacturing Market, by Manufacturing Type, 2022–2035 (USD Million)
TABLE 55: France Pharmaceutical Manufacturing Market, by Technology, 2022–2035 (USD Million)
TABLE 56: France Pharmaceutical Manufacturing Market, by End-User, 2022–2035 (USD Million)
TABLE 57: Russia Pharmaceutical Manufacturing Market, by Drug Type, 2022–2035 (USD Million)
TABLE 58: Russia Pharmaceutical Manufacturing Market, by Manufacturing Type, 2022–2035 (USD Million)
TABLE 59: Russia Pharmaceutical Manufacturing Market, by Drug Type, 2022–2035 (USD Million)
TABLE 60: Russia Pharmaceutical Manufacturing Market, by End-User, 2022–2035 (USD Million)
TABLE 61: Poland Pharmaceutical Manufacturing Market, by Technology, 2022–2035 (USD Million)
TABLE 62: Poland Pharmaceutical Manufacturing Market, by Manufacturing Type, 2022–2035 (USD Million)
TABLE 63: Poland Pharmaceutical Manufacturing Market, by Technology, 2022–2035 (USD Million)
TABLE 64: Poland Pharmaceutical Manufacturing Market, by End-User, 2022–2035 (USD Million)
TABLE 65: Rest of Europe Pharmaceutical Manufacturing Market, by Drug Type, 2022–2035 (USD Million)
TABLE 66: Rest of Europe Pharmaceutical Manufacturing Market, by Manufacturing Type, 2022–2035 (USD Million)
TABLE 67: Rest of Europe Pharmaceutical Manufacturing Market, by Technology, 2022–2035 (USD Million)
TABLE 68: Rest of Europe Pharmaceutical Manufacturing Market, by End-User, 2022–2035 (USD Million)
TABLE 69: Pharmaceutical Manufacturing Market, by Country (APAC), 2022–2035 (USD Million)
TABLE 70: Pharmaceutical Manufacturing Market, by Drug Type (APAC), 2022–2035 (USD Million)
TABLE 71: Pharmaceutical Manufacturing Market, by Manufacturing Type (APAC), 2022–2035 (USD Million)
TABLE 72: Pharmaceutical Manufacturing Market, by Technology(APAC), 2022–2035 (USD Million)
TABLE 73: Pharmaceutical Manufacturing Market, by End-User (APAC), 2022–2035 (USD Million)
TABLE 74: India Pharmaceutical Manufacturing Market, by Drug Type, 2022–2035 (USD Million)
TABLE 75: India Pharmaceutical Manufacturing Market, by Manufacturing Type, 2022–2035 (USD Million)
TABLE 76: India Pharmaceutical Manufacturing Market, by Technology, 2022–2035 (USD Million)
TABLE 77: India Pharmaceutical Manufacturing Market, by End-User, 2022–2035 (USD Million)
TABLE 78: China Pharmaceutical Manufacturing Market, by Drug Type, 2022–2035 (USD Million)
TABLE 79: China Pharmaceutical Manufacturing Market, by Manufacturing Type, 2022–2035 (USD Million)
TABLE 80: China Pharmaceutical Manufacturing Market, by Technology, 2022–2035 (USD Million)
TABLE 81: China Pharmaceutical Manufacturing Market, by End-User, 2022–2035 (USD Million)
TABLE 82: Japan Pharmaceutical Manufacturing Market, by Drug Type, 2022–2035 (USD Million)
TABLE 83: Japan Pharmaceutical Manufacturing Market, by Manufacturing Type, 2022–2035 (USD Million)
TABLE 84: Japan Pharmaceutical Manufacturing Market, by Technology, 2022–2035 (USD Million)
TABLE 85: Japan Pharmaceutical Manufacturing Market, by End-User, 2022–2035 (USD Million)
TABLE 86: South Korea Pharmaceutical Manufacturing Market, by Drug Type, 2022–2035 (USD Million)
TABLE 87: South Korea Pharmaceutical Manufacturing Market, by Manufacturing Type, 2022–2035 (USD Million)
TABLE 88: South Korea Pharmaceutical Manufacturing Market, by Technology, 2022–2035 (USD Million)
TABLE 89: South Korea Pharmaceutical Manufacturing Market, by End-User, 2022–2035 (USD Million)
TABLE 90: Australia Pharmaceutical Manufacturing Market, by Drug Type, 2022–2035 (USD Million)
TABLE 91: Australia Pharmaceutical Manufacturing Market, by Manufacturing Type, 2022–2035 (USD Million)
TABLE 92: Australia Pharmaceutical Manufacturing Market, by Technology, 2022–2035 (USD Million)
TABLE 93: Australia Pharmaceutical Manufacturing Market, by End-User, 2022–2035 (USD Million)
TABLE 94: Rest of APAC Pharmaceutical Manufacturing Market, by Drug Type, 2022–2035 (USD Million)
TABLE 95: Rest of APAC Pharmaceutical Manufacturing Market, by Manufacturing Type, 2022–2035 (USD Million)
TABLE 96: Rest of APAC Pharmaceutical Manufacturing Market, by Technology, 2022–2035 (USD Million)
TABLE 97: Rest of APAC Pharmaceutical Manufacturing Market, by End-User, 2022–2035 (USD Million)
TABLE 98: Brazil Pharmaceutical Manufacturing Market, by Drug Type, 2022–2035 (USD Million)
TABLE 99: Brazil Pharmaceutical Manufacturing Market, by Manufacturing Type, 2022–2035 (USD Million)
TABLE 100: Brazil Pharmaceutical Manufacturing Market, by Technology, 2022–2035 (USD Million)
TABLE 101: Brazil Pharmaceutical Manufacturing Market, by End-User, 2022–2035 (USD Million)
TABLE 102: Argentina Pharmaceutical Manufacturing Market, by Drug Type, 2022–2035 (USD Million)
TABLE 103: Argentina Pharmaceutical Manufacturing Market, by Manufacturing Type, 2022–2035 (USD Million)
TABLE 104: Argentina Pharmaceutical Manufacturing Market, by Technology, 2022–2035 (USD Million)
TABLE 105: Argentina Pharmaceutical Manufacturing Market, by End-User, 2022–2035 (USD Million)
TABLE 106: Colombia Pharmaceutical Manufacturing Market, by Drug Type, 2022–2035 (USD Million)
TABLE 107: Colombia Pharmaceutical Manufacturing Market, by Manufacturing Type, 2022–2035 (USD Million)
TABLE 108: Colombia Pharmaceutical Manufacturing Market, by Technology, 2022–2035 (USD Million)
TABLE 109: Colombia Pharmaceutical Manufacturing Market, by End-User, 2022–2035 (USD Million)
TABLE 110: Rest of LATAM Pharmaceutical Manufacturing Market, by Drug Type, 2022–2035 (USD Million)
TABLE 111: Rest of LATAM Pharmaceutical Manufacturing Market, by Manufacturing Type, 2022–2035 (USD Million)
TABLE 112: Rest of LATAM Pharmaceutical Manufacturing Market, by Technology, 2022–2035 (USD Million)
TABLE 113: Rest of LATAM Pharmaceutical Manufacturing Market, by End-User, 2022–2035 (USD Million)
TABLE 114: Israel Pharmaceutical Manufacturing Market, by Drug Type, 2022–2035 (USD Million)
TABLE 115: Israel Pharmaceutical Manufacturing Market, by Manufacturing Type, 2022–2035 (USD Million)
TABLE 116: Israel Pharmaceutical Manufacturing Market, by Technology, 2022–2035 (USD Million)
TABLE 117: Israel Pharmaceutical Manufacturing Market, by End-User, 2022–2035 (USD Million)
TABLE 118: Turkey Pharmaceutical Manufacturing Market, by Drug Type, 2022–2035 (USD Million)
TABLE 119: Turkey Pharmaceutical Manufacturing Market, by Manufacturing Type, 2022–2035 (USD Million)
TABLE 120: Turkey Pharmaceutical Manufacturing Market, by Technology, 2022–2035 (USD Million)
TABLE 121: Turkey Pharmaceutical Manufacturing Market, by End-User, 2022–2035 (USD Million)
TABLE 122: Egypt Pharmaceutical Manufacturing Market, by Drug Type, 2022–2035 (USD Million)
TABLE 123: Egypt Pharmaceutical Manufacturing Market, by Manufacturing Type, 2022–2035 (USD Million)
TABLE 124: Egypt Pharmaceutical Manufacturing Market, by Technology, 2022–2035 (USD Million)
TABLE 125: Egypt Pharmaceutical Manufacturing Market, by End-User, 2022–2035 (USD Million)
TABLE 126: Rest of MEA Pharmaceutical Manufacturing Market, by Drug Type, 2022–2035 (USD Million)
TABLE 127: Rest of MEA Pharmaceutical Manufacturing Market, by Manufacturing Type, 2022–2035 (USD Million)
TABLE 128: Rest of MEA Pharmaceutical Manufacturing Market, by Technology, 2022–2035 (USD Million)
TABLE 129: Rest of MEA Pharmaceutical Manufacturing Market, by End-User, 2022–2035 (USD Million)
List of Figures
FIGURE 1: Pharmaceutical Manufacturing Market Segmentation
FIGURE 2: Market Research Methodology
FIGURE 3: Value Chain Analysis
FIGURE 4: PESTLE Analysis
FIGURE 5: Porter’s Five Forces Analysis
FIGURE 6: Market Attractiveness Analysis
FIGURE 7: Market Dynamics
FIGURE 8: Innovation & Patent Landscape (2020–2024)
FIGURE 9: Competitive Landscape; Key Company Market Share Analysis, 2023
FIGURE 10: Drug Type Segment Market Share Analysis, 2023 & 2035
FIGURE 11: Drug Type Segment Market Size Forecast and Trend Analysis, 2024 to 2035 (USD Million)
FIGURE 12: Manufacturing Type Segment Market Share Analysis, 2023 & 2035
FIGURE 13: Manufacturing Type Segment Market Size Forecast and Trend Analysis, 2024 to 2035 (USD Million)
FIGURE 14: Drug Type Segment Market Share Analysis, 2023 & 2035
FIGURE 15: Drug Type Segment Market Size Forecast and Trend Analysis, 2024 to 2035 (USD Million)
FIGURE 16: End-User Segment Market Share Analysis, 2023 & 2035
FIGURE 17: End-User Segment Market Size Forecast and Trend Analysis, 2024 to 2035 (USD Million)
FIGURE 18: Regional Segment Market Share Analysis, 2023 & 2035
FIGURE 19: Regional Segment Market Size Forecast and Trend Analysis, 2024 to 2035 (USD Million)
FIGURE 20: North America Agricultural Biological Market Share and Leading Players, 2024
FIGURE 21: Europe Pharmaceutical Manufacturing Market Share and Leading Players, 2024
FIGURE 22: Asia Pacific Pharmaceutical Manufacturing Market Share and Leading Players, 2024
FIGURE 23: Latin America Pharmaceutical Manufacturing Market Share and Leading Players, 2024
FIGURE 24: Middle East and Africa Pharmaceutical Manufacturing Market Share and Leading Players, 2024
FIGURE 25: North America Market Share Analysis by Country, 2024
FIGURE 26: U.S. Pharmaceutical Manufacturing Market Size, Forecast and Trend Analysis, 2024 to 2035 (USD Million)
FIGURE 27: Canada Pharmaceutical Manufacturing Market Size, Forecast and Trend Analysis, 2024 to 2035 (USD Million)
FIGURE 28: Mexico Pharmaceutical Manufacturing Market Size, Forecast and Trend Analysis, 2024 to 2035 (USD Million)
FIGURE 29: Europe Pharmaceutical Manufacturing Market Share Analysis by Country, 2023
FIGURE 30: Germany Pharmaceutical Manufacturing Market Size, Forecast and Trend Analysis, 2024 to 2035 (USD Million)
FIGURE 31: Spain Pharmaceutical Manufacturing Market Size, Forecast and Trend Analysis, 2024 to 2035 (USD Million)
FIGURE 32: Italy Pharmaceutical Manufacturing Market Size, Forecast and Trend Analysis, 2024 to 2035 (USD Million)
FIGURE 33: France Pharmaceutical Manufacturing Market Size, Forecast and Trend Analysis, 2024 to 2035 (USD Million)
FIGURE 34: UK Pharmaceutical Manufacturing Market Size, Forecast and Trend Analysis, 2024 to 2035 (USD Million)
FIGURE 35: Russia Pharmaceutical Manufacturing Market Size, Forecast and Trend Analysis, 2024 to 2035 (USD Million)
FIGURE 36: Poland Pharmaceutical Manufacturing Market Size, Forecast and Trend Analysis, 2024 to 2035 (USD Million)
FIGURE 37: Rest of Europe Pharmaceutical Manufacturing Market Size, Forecast and Trend Analysis, 2024 to 2035 (USD Million)
FIGURE 38: Asia Pacific Pharmaceutical Manufacturing Market Share Analysis by Country, 2023
FIGURE 39: India Pharmaceutical Manufacturing Market Size, Forecast and Trend Analysis, 2024 to 2035 (USD Million)
FIGURE 40: China Pharmaceutical Manufacturing Market Size, Forecast and Trend Analysis, 2024 to 2035 (USD Million)
FIGURE 41: Japan Pharmaceutical Manufacturing Market Size, Forecast and Trend Analysis, 2024 to 2035 (USD Million)
FIGURE 42: South Korea Pharmaceutical Manufacturing Market Size, Forecast and Trend Analysis, 2024 to 2035 (USD Million)
FIGURE 43: Australia Pharmaceutical Manufacturing Market Size, Forecast and Trend Analysis, 2024 to 2035 (USD Million)
FIGURE 44: Rest of APAC Pharmaceutical Manufacturing Market Size, Forecast and Trend Analysis, 2024 to 2035 (USD Million)
FIGURE 45: Latin America Pharmaceutical Manufacturing Market Size, Forecast and Trend Analysis, 2024 to 2035 (USD Million)
FIGURE 46: Latin America Pharmaceutical Manufacturing Market Share Analysis by Country, 2023
FIGURE 47: Brazil Pharmaceutical Manufacturing Market Size, Forecast and Trend Analysis, 2024 to 2035 (USD Million)
FIGURE 48: Argentina Pharmaceutical Manufacturing Market Size, Forecast and Trend Analysis, 2024 to 2035 (USD Million)
FIGURE 49: Colombia Pharmaceutical Manufacturing Market Size, Forecast and Trend Analysis, 2024 to 2035 (USD Million)
FIGURE 50: Rest of LATAM Pharmaceutical Manufacturing Market Size, Forecast and Trend Analysis, 2024 to 2035 (USD Million)
FIGURE 51: Middle East and Africa Pharmaceutical Manufacturing Market Size, Forecast and Trend Analysis, 2024 to 2035 (USD Million)
FIGURE 52: Middle East and Africa Pharmaceutical Manufacturing Market Share Analysis by Country, 2023
FIGURE 53: GCC Countries (Saudi Arabia, UAE, Qatar, Kuwait, Oman, Bahrain) Pharmaceutical Manufacturing Market Size, Forecast and Trend Analysis, 2024 to 2035 (USD Million)
FIGURE 54: Israel Pharmaceutical Manufacturing Market Size, Forecast and Trend Analysis, 2024 to 2035 (USD Million)
FIGURE 55: Turkey Pharmaceutical Manufacturing Market Size, Forecast and Trend Analysis, 2024 to 2035 (USD Million)
FIGURE 56: Egypt Pharmaceutical Manufacturing Market Size, Forecast and Trend Analysis, 2024 to 2035 (USD Million)
FIGURE 57: Rest of MEA Pharmaceutical Manufacturing Market Size, Forecast and Trend Analysis, 2024 to 2035 (USD Million)
- "The depth of analysis in this Pharmaceutical Manufacturing Market Research Report far exceeded our expectations. We were evaluating contract manufacturing partnerships across North America and APAC, and the region-wise capacity insights and regulatory landscape breakdown helped us shortlist the right locations and vendors. The forecast models were grounded and extremely helpful in shaping our 3-year procurement roadmap. It’s clear the team behind this report knows the pulse of the manufacturing ecosystem."
- David Whitmore, Director of Strategic Sourcing, Mid-sized Pharma Firm (USA)
- "As a company looking to scale biologics manufacturing in Europe, we needed more than just market figures, we needed a strategic lens. This report offered just that. The analysis on advanced technologies like continuous manufacturing, coupled with competitor benchmarking, played a crucial role in validating our CapEx investment plan. The language was clear yet technical enough for C-level conversations. This is not generic content, it's real intelligence."
- Anika Schreiber, VP, Corporate Development, Biotech Manufacturing Venture (Germany)
- "We review dozens of market reports annually, and few are as thoughtfully constructed as this one. The insights on manufacturing trends in emerging Asian markets and their regulatory alignment were extremely useful for our portfolio screening. The combination of primary interviews, trend extrapolation, and risk mapping made this a trusted source for our due diligence. It gave us both macro context and micro-level indicators to assess potential M&A targets in the region."
- Kenji Nakamura, Senior Market Analyst, Pharmaceutical Investment Advisory Group (Japan)
This report on the Pharmaceutical Manufacturing Market 2025 has been developed by the research team at Quants & Trends, a specialized healthcare market intelligence firm with over a decade of expertise in tracking and analyzing pharmaceutical, biotech, and medtech markets. Our analysts bring together deep domain experience, academic rigor, and real-world consulting insight to deliver research that fuels strategic decision-making for global healthcare enterprises.
Led by a core team of industry experts, Quants & Trends has collaborated with top pharma manufacturers, CDMOs, regulatory consultants, and investment firms to decode market shifts, identify actionable opportunities, and assess competitive risk. We understand that pharmaceutical manufacturing is not just about production, it's a complex ecosystem driven by regulatory frameworks, innovation pipelines, supply chain resilience, and global cost pressures. This report offers forward-looking intelligence that supports decisions on capacity expansion, M&A evaluations, vendor selection, and regional investments.
Every data point, growth estimate, and strategic recommendation presented in this report is backed by meticulous research, proprietary forecasting models, and verified primary interviews with industry stakeholders. Whether you're a strategy head in a global pharma firm or a private equity partner evaluating manufacturing assets, this report is crafted to deliver clarity, confidence, and strategic foresight.
We are committed to transparency and professional integrity in all our publications. To explore our research approach, team credentials, and latest updates, connect with us via our official LinkedIn page.