Market Outlook
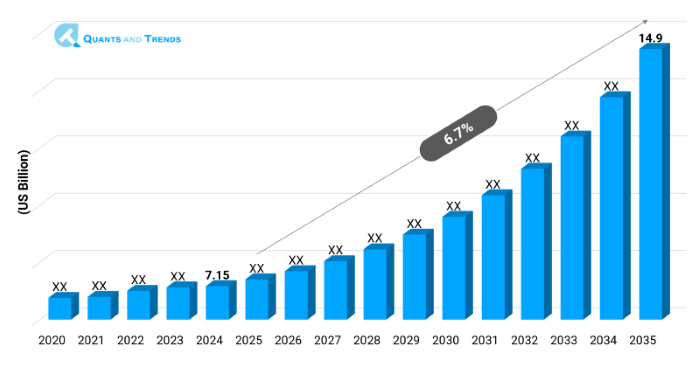
The global Lab Automation market was valued at approximately USD 7.15 billion in 2024 and is projected to grow at a compound annual growth rate (CAGR) of 6.7% from 2025 to 2035, reaching around USD 14.9 billion by the end of the forecast period. The historical analysis starts from 2020 to 2023, with 2024 as the base year and the forecast starts from 2025 to 2035.
The Lab Automation Market has been growing at an unprecedented rate due to the increased demand of the laboratories towards achieving throughput, precision, and cost-efficiency. Lab Automation Market Forecasts show that there will be an increase in demand in the diagnostics, pharmaceutical R&D, and clinical labs. Hiking the compliances to work regulations, manpower shortages, and the introduction of AI-driven robotics is revolutionizing the workflows-enhancing the levels of accuracy and reproducibility. In this transition, Technology Adoption in Lab Automation has made real-time data analytics and remote monitoring possible. North America dominates the market share with the Asia-Pacific demonstrating a faster market expansion as a result of research activities and infrastructure investments.
| Base Year | 2024 |
|---|---|
| Forecast Period | 2025-2035 |
| Historical Period | 2020-2023 |
| CAGR | 6.7% |
| Market Value In 2024 | USD 7.15 billion |
| Market Value In 2035 | USD 14.9 billion |
Introduction
Lab automation can be defined as the application of the robotic automation, software, and complex platforms to automate the process of sample handling, pipetting, and data management. Lab Automation Market is gaining a lot of momentum where pharmaceutical, biotech and clinical institutions are trying to minimize human error and maximize productivity. As automation becomes the only way to meet the growing demand of high-throughput screening, genomics and diagnosis, automation is becoming mandatory. The drive to adoption occurs with the advent of robotics, continuous-flows and standardized procedures. The laboratories aided by lab automation investment opportunities are streamlining their businesses, cutting down the turnaround time, and facilitating scalable workflows in research and diagnostics.
Key Market Drivers: What’s Fueling the Lab Automation Market Boom?
- Increased Demand of High-throughput Screening: High-throughput screening (HTS) technologies are the basis of the drug discovery and biochemical analysis. With the advancing urgency to develop new products on a faster timeline, pharmaceutical companies increasingly require automation in labs so that thousands of compounds can be tested on a timely basis with a minimum input of humans involved in the process, which lowers time cycle. The factor that has contributed to the rising use of robotic systems and microplate readers in research is attributable to this driver.
- Increasing attentiveness on minimizing human error: Human error is a factor that is likely to occur in a laboratory that involves delivering manual operations. Automation eliminates the possibility of errors that can occur during pipetting, sample manipulation, and data harvesting since it is uniform. This is especially crucial during clinical diagnosis and regulatory approved settings i.e., in labs certified to GMP.
Note: Charts and figures are illustrative only. Contact us for verified market data.
Innovation in Focus: How Manufacturers Are Raising the Bar?
The Lab Automation Market is headed towards AI-guided robotics and cloud laboratories as well as self-driving orchestration systems in the lab. Automated systems such as self-driving labs and automated scheduling systems with AI maximize workload, cut time-to-result and maximize throughput. With cloud‑based lab environments, researchers are allowed to execute protocols remotely and have live access to their data. Zero‑configuration modules and modularity, such as LABIIUM are contributing to the improvement of accessibility and productivity. These technology trends are transforming the way labs are being run and setting new frontiers in the opportunities of automated scalable, and smart experimentation.
Recent Developments:
In August 2025, SGPGIMS in India opened the first fully automated pathology lab in the state on Beckman Coulter systems that processes more than 4,000 tests an hour dramatically cutting down on turnaround times and improving the accuracy of diagnosis.
Conclusion
The Lab Automation Market is currently at a turning point with demand fueled by requirements in terms of efficiency, accuracy, and scalability, within the diagnostics and bio-research markets. Processes are diverse and moving away, and high‑throughput screening and compliance require automation, notably AI-optimized robotics and cloud labs. The opportunities are there since the company is on a strong streak with its expansion on the Asian-Pacific geographical region and has a command in North America. The path to success will be investment in interoperability and standardization and R&D. As modular platforms and self-positioning labs become commonplace, the Lab Automation Market Size & Share will continue growing, as it is a value opportunity in the automation of laboratory operations and the achievement of scientific discoveries at faster rates.
Related Reports
- The global Pharmaceutical Manufacturing Market was valued at approximately USD 584.2 billion in 2024 and is projected to grow at a compound annual growth rate (CAGR) of 12.4% from 2025 to 2035, reaching around USD 2,110.9 billion by the end of the forecast period.
- The global Healthcare Robotics Market was valued at approximately USD 17.8 billion in 2024 and is projected to grow at a compound annual growth rate (CAGR) of 16.4% from 2025 to 2035, reaching around USD 94.2 billion by the end of the forecast period.
Key Market Players
The international competitive environment in the Lab Automation market consists of fragmentation but is moving towards consolidation with large pharma companies and smaller biotechnology companies competing aggressively. Co-development agreements, regional licensing and strategic alliances are becoming more and more popular. Business organizations are working on affordable production, regulatory aspects, and diversification by means of adding more therapeutic products. The market entry of newer players is also fast due to M&A activities. Lab Automation market report underlines the role of Lab Automation lifecycle management and patent litigation plans, which ensure the competitive advantage in such a changing environment. Some of the key players in the Lab Automation industry are as:
Thermo Fisher Scientific, Danaher Corporation (Beckman Coulter), Agilent Technologies, Siemens Healthineers, PerkinElmer, Tecan Group Ltd., Qiagen, Eppendorf, Hamilton Company, Opentrons (Opentrons Labworks), Hudson Robotics, Aurora Biomed, BMG LABTECH, Gilson Inc., Peak Analysis & Automation
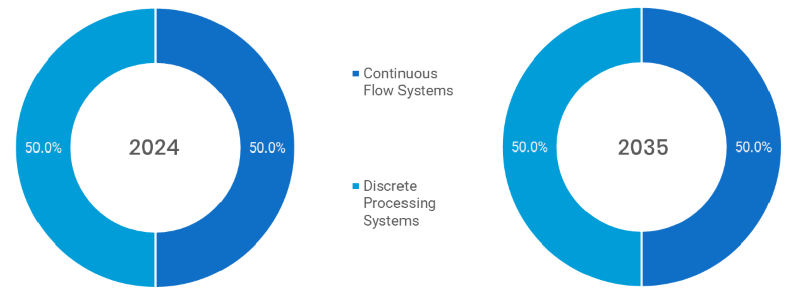
- Continuous Flow Systems (Dominated): Allows a high-throughput sample handling with minimal operator interface, which is perfectly suited to repetitive diagnostic applications such as clinical chemistry and immunoassays.
- Discrete Processing Systems (Fastest): Suitable to accommodate flexible, task-specific workflows in research and development laboratories, enabling customizable automation characterized by modular instruments, and task scheduling.
Note: Charts and figures are illustrative only. Contact us for verified market data.
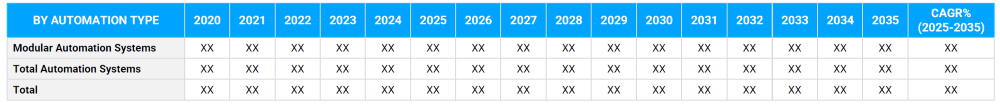
- Modular Automations (Fastest): Are cost-effective and scalable to smaller labs and they are able to automate customizable processes (such as sample prep or liquid handling).
- Total Automation Systems (Dominated): Offer complete lab automation of large scale laboratories to eliminate human error and ensure smooth and continuous work across workflows.
Note: Charts and figures are illustrative only. Contact us for verified market data.
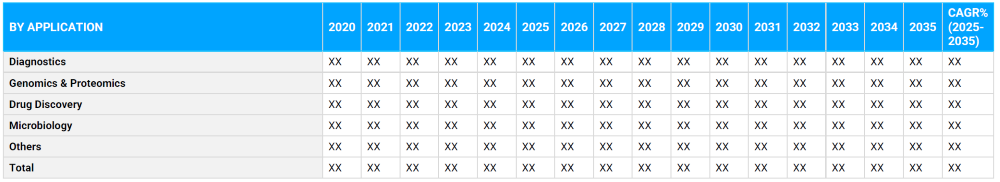
Segmentation By Application
- Diagnostics (Dominated): The adoption of lead is occurring as a result of automation in clinical chemistry and immunoassay so as to permit faster and more precise diagnosis.
- Genomics and Proteomics: Accelerate at very fast rates due to demands of precision medicine, which involves automated sequencing, sample processing/handling as well as processing of proteomic data.
- Drug Discovery (fastest): High-throughput screening and compound testing should be adopted using automation and this will cut the time-to-market by pharmaceutical development pipelines.
- Microbiology: To run pathogen detection and culture-handling processes using automation producing superior results in terms of accuracy and contamination management in micro biology.
- Other: This may involve forensics, food testing and environmental labs which need efficiency, accuracy and traceability of samples.
Note: Charts and figures are illustrative only. Contact us for verified market data.
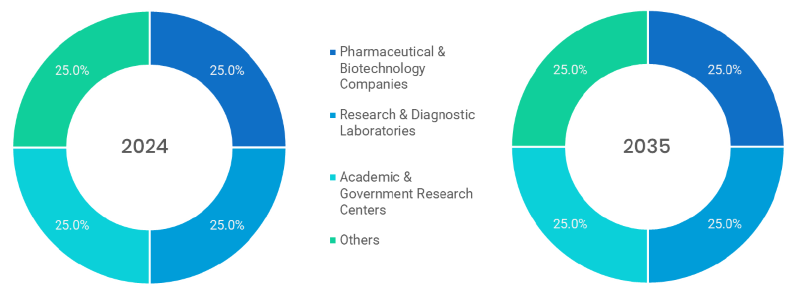
- Pharmaceutical & Biotechnology Companies (Dominated): Automate R&D, clinical trials and compound libraries to speed drug pipeline schedules, and lower operational expense.
- Research’s & Diagnostic Laboratories (fastest): Take advantage of automation to achieve faster diagnostics, repeatable outcomes and automated sample handling in both public and areas of privatized laboratory and medical research.
- Government, and Academic Research Centers: Use lab automation on grant funded work to achieve consistency, reproducibility and widespread science publications and studies.
- Others: CRO, contract manufacturers, automation: These companies are seeking to provide their customers, who require fast-growing lab operation, with automation.
Note: Charts and figures are illustrative only. Contact us for verified market data.
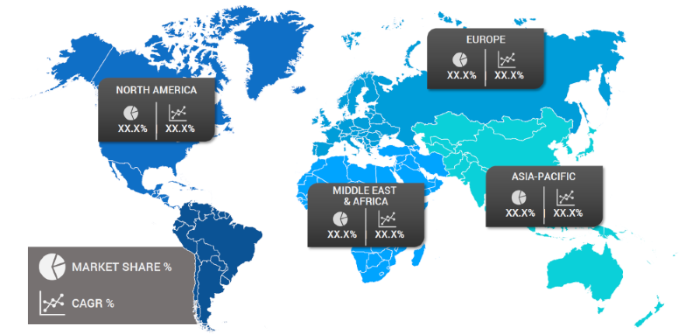
Segmentation By Region
Where the Market is Growing Fastest?
Lab Automation market has been categorised by geography into North America, Europe, Asia-Pacific, Latin America, and Middle East & Africa. Europe is dominating the overall market with early adoption of regulations, high physician awareness and popularity among payers. The fastest-growing region is Asia-Pacific, and India, South Korea and China are dominating due to their proper domestic production capabilities, regulatory reforms, and availability of patients. Rising governmental supply and rising Lab Automation export is enhancing the market position of the region further. Regional analysis implies that an increase in healthcare spending and better availability of avenues of biologics are increasing the position of bio similars both in developed and emerging economies.
The following nations and regions will be covered in the report:
• North America: U.S., Canada and Mexico
• Asia Pacific: China, India, Japan, South Korea, Australia, among others
• Europe: Germany, France, Italy, Spain, UK, Russia, Rest of Europe
• Latin America: Brazil, Argentina, Colombia
• Middle East & Africa: Saudi Arabia, UAE, South Africa, Israel, Turkey
Note: Charts and figures are illustrative only. Contact us for verified market data.
1. Lab Automation Market: Market Introduction & Context
1.1. Market Definition
1.2. Scope of the Study
1.3. Research Methodology
1.3.1. Primary Data Collection
1.3.2. Secondary Data Sourcing
1.3.3. External Industry Collaborations
1.3.4. In-House Research Databases
1.3.5. Analytical Frameworks & Forecasting End-Users
1.3.6. Data Validation and Final Report Publishing
1.4. Key Assumptions
1.5. Market Ecosystem Overview
1.6. Stakeholder Analysis (Manufacturers, Suppliers, Growers, Distributors, Retailers)
(introduces the report’s scope, methodology, and assumptions to help the client clearly understand the study's coverage, data sources, and reliability)
2. Lab Automation Market: Executive Summary
2.1. Key Insights & Market Snapshots
2.2. Analyst Viewpoint
2.3. Market Attractiveness Index
(offers a brief yet insightful market summary, giving the client a quick grasp of key trends, market potential, and strategic highlights)
3. Lab Automation Market: Market Dynamics & Outlook
3.1. Drivers and their impact analysis
3.2. Restraints and their impact analysis
3.3. Opportunities and their impact analysis (Emerging Markets, New Process Categories)
3.4. Patent & Innovation Analysis (2020–2024)
(explains the major drivers, restraints, opportunities, and challenges shaping the market, enabling the client to assess both growth prospects and potential risks)
4. Lab Automation Market: Market Environment & Industry
4.1. PESTEL Analysis
4.1.1. Political
4.1.2. Economic
4.1.3. Social
4.1.4. Technological
4.1.5. Environmental
4.1.6. Legal
4.2. Porter’s Five Forces Analysis
4.2.1. Threat of New Entrants
4.2.2. Bargaining Power of Buyers
4.2.3. Bargaining Power of Suppliers
4.2.4. Substitution Risk
4.2.5. Competitive Rivalry
4.3. Pricing Trend Analysis by Region (2024–2030)
4.4. Value Chain & Supply Chain Analysis
4.5. Impact of Digitalization
4.6. Process Type & Innovation Landscape
4.7. Regulatory Framework Analysis
4.7.1. Global & Regional Regulations
4.7.1.1. North America
4.7.1.2. Europe
4.7.1.3. APAC
4.7.1.4. LATAM
4.7.1.5. MEA
4.8. Import/Export Restrictions & Tariff Impact
4.9. Government Initiatives
4.10. Impact of Escalating Geopolitical Tensions
(provides an overview of the industry landscape, covering market dynamics, technological advancements, pricing trends, and regulatory influences for informed decision-making)
5. Lab Automation Market – By Process Type
5.1. Overview
5.1.1. Segment Share Analysis, By Process Type, 2024 & 2035 (%)
5.1.2. Continuous Flow Systems
5.1.3. Discrete Processing Systems
(presents market segmentation By Process Type, guiding the client on the Process categories that are expected to drive demand and shape future revenue streams)
6. Lab Automation Market – By Automation Type
6.1. Overview
6.1.1. Segment Share Analysis, By Automation Type, 2024 & 2035 (%)
6.1.2. Modular Automation Systems
6.1.3. Total Automation Systems
(breaks down the market by Automation Type, assisting the client in identifying material or origin preferences and emerging growth segments)
7. Lab Automation Market – By Application
7.1. Overview
7.1.1. Segment Share Analysis, By Application, 2024 & 2035 (%)
7.1.2. Diagnostics
7.1.3. Genomics & Proteomics
7.1.4. Drug Discovery
7.1.5. Microbiology
7.1.6. Other
(focuses on market segmentation by Application, helping the client prioritize specific Applications or end-use areas that offer significant business opportunities)
8. Lab Automation Market – By End-User
8.1. Overview
8.1.1. Segment Share Analysis, By End-User, 2024 & 2035 (%)
8.1.2. Pharmaceutical & Biotechnology Companies
8.1.3. Research & Diagnostic Laboratories
8.1.4. Academic & Government Research Centers
8.1.5. Others
(describes the market division by End-User of Process Type, enabling the client to understand which usage methods are preferred and where future demand may rise)
9. Lab Automation Market– By Geography
9.1. Introduction
9.1.1. Segment Share Analysis, By Geography, 2024 & 2035 (%)
9.2. North America
9.2.1. Regional Overview & Trends
9.2.2. Lab Automation Key Manufacturers in North America
9.2.3. North America Market Size and Forecast, By Country, 2024 - 2035 (US$ Million)
9.2.4. North America Market Size and Forecast, By Process Type, 2024 - 2035 (US$ Million)
9.2.5. North America Market Size and Forecast, By Automation Type, 2024 - 2035 (US$ Million)
9.2.6. North America Market Size and Forecast, By Application, 2024 - 2035 (US$ Million)
9.2.7. North America Market Size and Forecast, By End-User, 2024 - 2035 (US$ Million)
9.2.8. U.S.
9.2.8.1. Overview
9.2.8.2. U.S. Market Size and Forecast, By Process Type, 2024 - 2035 (US$ Million)
9.2.8.3. U.S. Market Size and Forecast, By Automation Type, 2024 - 2035 (US$ Million)
9.2.8.4. U.S. Market Size and Forecast, By Application, 2024 - 2035 (US$ Million)
9.2.8.5. U.S. Market Size and Forecast, By End-User, 2024 - 2035 (US$ Million)
9.2.9. Canada
9.2.9.1. Overview
9.2.9.2. Canada Market Size and Forecast, By Process Type, 2024 - 2035 (US$ Million)
9.2.9.3. Canada Market Size and Forecast, By Automation Type, 2024 - 2035 (US$ Million)
9.2.9.4. Canada Market Size and Forecast, By Application, 2024 - 2035 (US$ Million)
9.2.9.5. Canada Market Size and Forecast, By End-User, 2024 - 2035 (US$ Million)
9.2.10. Mexico
9.2.10.1. Overview
9.2.10.2. Mexico Market Size and Forecast, By Process Type, 2024 - 2035 (US$ Million)
9.2.10.3. Mexico Market Size and Forecast, By Automation Type, 2024 - 2035 (US$ Million)
9.2.10.4. Mexico Market Size and Forecast, By Application, 2024 - 2035 (US$ Million)
9.2.10.5. Mexico Market Size and Forecast, By End-User, 2024 - 2035 (US$ Million)
Note: Similar information and analysis will be provided for all other regions (Europe, APAC, LATAM and MEA) and countries listed in the subsequent sections.
9.3. Europe
9.3.1. Germany
9.3.2. Italy
9.3.3. United Kingdom
9.3.4. France
9.3.5. Russia
9.3.6. Poland
9.3.7. Rest of Europe
9.4. Asia Pacific (APAC)
9.4.1. India
9.4.2. China
9.4.3. Japan
9.4.4. South Korea
9.4.5. Australia
9.4.6. Rest of APAC
9.5. Latin America
9.5.1. Brazil
9.5.2. Argentina
9.5.3. Colombia
9.5.4. Rest of LATAM
9.6. Middle East and Africa
9.6.1. Israel
9.6.2. Turkey
9.6.3. Egypt
9.6.4. Rest of MEA
(delivers a detailed regional and country-level analysis, supporting the client in recognizing growth hotspots and strategically allocating resources across geographies)
10. Lab Automation Market: Competitive Landscape & Company Profiles
10.1. Market Share Analysis (2024)
10.2. Company Positioning Matrix (Leaders, Innovators, Emerging Players)
10.3. Company Profiles (Key Players: Overview, Processs, Strategies, Financials, Recent Developments)
10.3.1. Thermo Fisher Scientific
10.3.2. Danaher Corporation (Beckman Coulter)
10.3.3. Agilent Technologies
10.3.4. Siemens Healthineers
10.3.5. PerkinElmer
10.3.6. Tecan Group Ltd.
10.3.7. Qiagen
10.3.8. Eppendorf
10.3.9. Hamilton Company
10.3.10. Opentrons (Opentrons Labworks)
10.3.11. Hudson Robotics
10.3.12. Aurora Biomed
10.3.13. BMG LABTECH
10.3.14. Gilson Inc.
10.3.15. Peak Analysis & Automation.
10.3.16. Others
Note: All company profiles will include details under the standard heads mentioned in section 10.3 - Overview, Process, Strategies, Financials, and Recent Developments. We also offer customization of the company profiling section based on your specific requirements.
(provides an assessment of key competitors, market shares, and strategic developments, giving the client essential insights to benchmark against or collaborate with industry leaders)
11. Lab Automation Market: Future Market Outlook (2025–2035)
11.1.1. Scenario Analysis (Optimistic, Realistic, Pessimistic)
11.1.2. Disruptive Technologies Impact
11.1.3. Emerging Business Trends
11.1.4. Business Opportunities for startups and existing players
(presents market forecasts and future outlook scenarios, preparing the client for upcoming trends, innovations, and potential shifts in market structure)
12. Lab Automation Market: Strategic Recommendations
(offers strategic recommendations for various stakeholders, enabling the client to make informed business decisions that maximize growth and minimize risks)
13. Lab Automation Market: Disclaimer
(states the report’s disclaimers and legal boundaries, ensuring the client understands the terms of use, limitations, and responsibilities associated with the report)
List of Tables
TABLE 1: List of Data Sources
TABLE 2: Market Drivers; Impact Analysis
TABLE 3: Market Restraints; Impact Analysis
TABLE 4: Lab Automation Market: Process Type Snapshot (2024)
TABLE 5: Segment Dashboard; Definition and Scope, By Process Type
TABLE 6: Global Lab Automation Market, By Process Type 2022–2035 (USD Billion)
TABLE 7: Lab Automation Market: Automation Type Snapshot (2024)
TABLE 8: Segment Dashboard; Definition and Scope, by Automation Type
TABLE 9: Global Lab Automation Market, by Automation Type 2022–2035 (USD Billion)
TABLE 10: Lab Automation Market: Application Snapshot (2024)
TABLE 11: Segment Dashboard; Definition and Scope, By Application
TABLE 12: Global Lab Automation Market, by Application 2022–2035 (USD Billion)
TABLE 13: Lab Automation Market: End-User Snapshot (2024)
TABLE 14: Segment Dashboard; Definition and Scope, by End-User
TABLE 15: Global Lab Automation Market, by End-User 2022–2035 (USD Billion)
TABLE 16: Lab Automation Market: Regional Snapshot (2024)
TABLE 17: Segment Dashboard; Definition and Scope, by Region
TABLE 18: Global Lab Automation Market, by Region 2022–2035 (USD Billion)
TABLE 19: Lab Automation Market, by Country (NA), 2022–2035 (USD Billion)
TABLE 20: Lab Automation Market, By Process Type (NA), 2022–2035 (USD Billion)
TABLE 21: Lab Automation Market, by Automation Type (NA), 2022–2035 (USD Billion)
TABLE 22: Lab Automation Market, by Application (NA), 2024–2035 (USD Billion)
TABLE 23: Lab Automation Market, by End-User (NA), 2022–2035 (USD Billion)
TABLE 24: U.S. Lab Automation Market, By Process Type, 2022–2035 (USD Billion)
TABLE 25: U.S. Lab Automation Market, by Automation Type, 2022–2035 (USD Billion)
TABLE 26: U.S. Lab Automation Market, by Application, 2022–2035 (USD Billion)
TABLE 27: U.S. Lab Automation Market, by End-User, 2022–2035 (USD Billion)
TABLE 28: Canada Lab Automation Market, By Process Type, 2022–2035 (USD Billion)
TABLE 29: Canada Lab Automation Market, by Automation Type, 2022–2035 (USD Billion)
TABLE 30: Canada Lab Automation Market, by Application, 2022–2035 (USD Billion)
TABLE 31: Canada Lab Automation Market, by End-User, 2022–2035 (USD Billion)
TABLE 32: Mexico Lab Automation Market, By Process Type, 2022–2035 (USD Billion)
TABLE 33: Mexico Lab Automation Market, by Automation Type, 2022–2035 (USD Billion)
TABLE 34: Mexico Lab Automation Market, by Application, 2022–2035 (USD Billion)
TABLE 35: Mexico Lab Automation Market, by End-User, 2022–2035 (USD Billion)
TABLE 36: Lab Automation Market, by Country (Europe), 2022–2035 (USD Billion)
TABLE 37: Lab Automation Market, By Process Type (Europe), 2022–2035 (USD Billion)
TABLE 38: Lab Automation Market, by Automation Type (Europe), 2022–2035 (USD Billion)
TABLE 39: Lab Automation Market, by Application(Europe), 2022–2035 (USD Billion)
TABLE 40: Lab Automation Market, by End-User (Europe), 2022–2035 (USD Billion)
TABLE 41: Germany Lab Automation Market, By Process Type, 2022–2035 (USD Billion)
TABLE 42: Germany Lab Automation Market, by Automation Type, 2022–2035 (USD Billion)
TABLE 43: Germany Lab Automation Market, by v, 2022–2035 (USD Billion)
TABLE 44: Germany Lab Automation Market, by End-User, 2022–2035 (USD Billion)
TABLE 45: Italy Lab Automation Market, By Process Type, 2022–2035 (USD Billion)
TABLE 46: Italy Lab Automation Market, by Automation Type, 2022–2035 (USD Billion)
TABLE 47: Italy Lab Automation Market, by Application, 2022–2035 (USD Billion)
TABLE 48: Italy Lab Automation Market, by End-User, 2022–2035 (USD Billion)
TABLE 49: United Kingdom Lab Automation Market, By Process Type, 2022–2035 (USD Billion)
TABLE 50: United Kingdom Lab Automation Market, by Automation Type, 2022–2035 (USD Billion)
TABLE 51: United Kingdom Lab Automation Market, by Application, 2022–2035 (USD Billion)
TABLE 52: United Kingdom Lab Automation Market, by End-User, 2022–2035 (USD Billion)
TABLE 53: France Lab Automation Market, By Process Type, 2022–2035 (USD Billion)
TABLE 54: France Lab Automation Market, by Automation Type, 2022–2035 (USD Billion)
TABLE 55: France Lab Automation Market, by Application, 2022–2035 (USD Billion)
TABLE 56: France Lab Automation Market, by End-User, 2022–2035 (USD Billion)
TABLE 57: Russia Lab Automation Market, By Process Type, 2022–2035 (USD Billion)
TABLE 58: Russia Lab Automation Market, by Automation Type, 2022–2035 (USD Billion)
TABLE 59: Russia Lab Automation Market, By Process Type, 2022–2035 (USD Billion)
TABLE 60: Russia Lab Automation Market, by End-User, 2022–2035 (USD Billion)
TABLE 61: Poland Lab Automation Market, by Application, 2022–2035 (USD Billion)
TABLE 62: Poland Lab Automation Market, by Automation Type, 2022–2035 (USD Billion)
TABLE 63: Poland Lab Automation Market, by Application, 2022–2035 (USD Billion)
TABLE 64: Poland Lab Automation Market, by End-User, 2022–2035 (USD Billion)
TABLE 65: Rest of Europe Lab Automation Market, By Process Type, 2022–2035 (USD Billion)
TABLE 66: Rest of Europe Lab Automation Market, by Automation Type, 2022–2035 (USD Billion)
TABLE 67: Rest of Europe Lab Automation Market, by Application, 2022–2035 (USD Billion)
TABLE 68: Rest of Europe Lab Automation Market, by End-User, 2022–2035 (USD Billion)
TABLE 69: Lab Automation Market, by Country (APAC), 2022–2035 (USD Billion)
TABLE 70: Lab Automation Market, By Process Type (APAC), 2022–2035 (USD Billion)
TABLE 71: Lab Automation Market, by Automation Type (APAC), 2022–2035 (USD Billion)
TABLE 72: Lab Automation Market, by Application(APAC), 2022–2035 (USD Billion)
TABLE 73: Lab Automation Market, by End-User (APAC), 2022–2035 (USD Billion)
TABLE 74: India Lab Automation Market, By Process Type, 2022–2035 (USD Billion)
TABLE 75: India Lab Automation Market, by Automation Type, 2022–2035 (USD Billion)
TABLE 76: India Lab Automation Market, by Application, 2022–2035 (USD Billion)
TABLE 77: India Lab Automation Market, by End-User, 2022–2035 (USD Billion)
TABLE 78: China Lab Automation Market, By Process Type, 2022–2035 (USD Billion)
TABLE 79: China Lab Automation Market, by Automation Type, 2022–2035 (USD Billion)
TABLE 80: China Lab Automation Market, by Application, 2022–2035 (USD Billion)
TABLE 81: China Lab Automation Market, by End-User, 2022–2035 (USD Billion)
TABLE 82: Japan Lab Automation Market, By Process Type, 2022–2035 (USD Billion)
TABLE 83: Japan Lab Automation Market, by Automation Type, 2022–2035 (USD Billion)
TABLE 84: Japan Lab Automation Market, by Application, 2022–2035 (USD Billion)
TABLE 85: Japan Lab Automation Market, by End-User, 2022–2035 (USD Billion)
TABLE 86: South Korea Lab Automation Market, By Process Type, 2022–2035 (USD Billion)
TABLE 87: South Korea Lab Automation Market, by Automation Type, 2022–2035 (USD Billion)
TABLE 88: South Korea Lab Automation Market, by Application, 2022–2035 (USD Billion)
TABLE 89: South Korea Lab Automation Market, by End-User, 2022–2035 (USD Billion)
TABLE 90: Australia Lab Automation Market, By Process Type, 2022–2035 (USD Billion)
TABLE 91: Australia Lab Automation Market, by Automation Type, 2022–2035 (USD Billion)
TABLE 92: Australia Lab Automation Market, by Application, 2022–2035 (USD Billion)
TABLE 93: Australia Lab Automation Market, by End-User, 2022–2035 (USD Billion)
TABLE 94: Rest of APAC Lab Automation Market, By Process Type, 2022–2035 (USD Billion)
TABLE 95: Rest of APAC Lab Automation Market, by Automation Type, 2022–2035 (USD Billion)
TABLE 96: Rest of APAC Lab Automation Market, by Application, 2022–2035 (USD Billion)
TABLE 97: Rest of APAC Lab Automation Market, by End-User, 2022–2035 (USD Billion)
TABLE 98: Brazil Lab Automation Market, By Process Type, 2022–2035 (USD Billion)
TABLE 99: Brazil Lab Automation Market, by Automation Type, 2022–2035 (USD Billion)
TABLE 100: Brazil Lab Automation Market, by Application, 2022–2035 (USD Billion)
TABLE 101: Brazil Lab Automation Market, by End-User, 2022–2035 (USD Billion)
TABLE 102: Argentina Lab Automation Market, By Process Type, 2022–2035 (USD Billion)
TABLE 103: Argentina Lab Automation Market, by Automation Type, 2022–2035 (USD Billion)
TABLE 104: Argentina Lab Automation Market, by Application, 2022–2035 (USD Billion)
TABLE 105: Argentina Lab Automation Market, by End-User, 2022–2035 (USD Billion)
TABLE 106: Colombia Lab Automation Market, By Process Type, 2022–2035 (USD Billion)
TABLE 107: Colombia Lab Automation Market, by Automation Type, 2022–2035 (USD Billion)
TABLE 108: Colombia Lab Automation Market, by Application, 2022–2035 (USD Billion)
TABLE 109: Colombia Lab Automation Market, by End-User, 2022–2035 (USD Billion)
TABLE 110: Rest of LATAM Lab Automation Market, By Process Type, 2022–2035 (USD Billion)
TABLE 111: Rest of LATAM Lab Automation Market, by Automation Type, 2022–2035 (USD Billion)
TABLE 112: Rest of LATAM Lab Automation Market, by Application, 2022–2035 (USD Billion)
TABLE 113: Rest of LATAM Lab Automation Market, by End-User, 2022–2035 (USD Billion)
TABLE 114: Israel Lab Automation Market, By Process Type, 2022–2035 (USD Billion)
TABLE 115: Israel Lab Automation Market, by Automation Type, 2022–2035 (USD Billion)
TABLE 116: Israel Lab Automation Market, by Application, 2022–2035 (USD Billion)
TABLE 117: Israel Lab Automation Market, by End-User, 2022–2035 (USD Billion)
TABLE 118: Turkey Lab Automation Market, By Process Type, 2022–2035 (USD Billion)
TABLE 119: Turkey Lab Automation Market, by Automation Type, 2022–2035 (USD Billion)
TABLE 120: Turkey Lab Automation Market, by Application, 2022–2035 (USD Billion)
TABLE 121: Turkey Lab Automation Market, by End-User, 2022–2035 (USD Billion)
TABLE 122: Egypt Lab Automation Market, By Process Type, 2022–2035 (USD Billion)
TABLE 123: Egypt Lab Automation Market, by Automation Type, 2022–2035 (USD Billion)
TABLE 124: Egypt Lab Automation Market, by Application, 2022–2035 (USD Billion)
TABLE 125: Egypt Lab Automation Market, by End-User, 2022–2035 (USD Billion)
TABLE 126: Rest of MEA Lab Automation Market, By Process Type, 2022–2035 (USD Billion)
TABLE 127: Rest of MEA Lab Automation Market, by Automation Type, 2022–2035 (USD Billion)
TABLE 128: Rest of MEA Lab Automation Market, by Application, 2022–2035 (USD Billion)
TABLE 129: Rest of MEA Lab Automation Market, by End-User, 2022–2035 (USD Billion)
List of Figures
FIGURE 1: Lab Automation Market Segmentation
FIGURE 2: Market Research Methodology
FIGURE 3: Value Chain Analysis
FIGURE 4: PESTLE Analysis
FIGURE 5: Porter’s Five Forces Analysis
FIGURE 6: Market Attractiveness Analysis
FIGURE 7: Market Dynamics
FIGURE 8: Innovation & Patent Landscape (2020–2024)
FIGURE 9: Competitive Landscape; Key Company Market Share Analysis, 2023
FIGURE 10: Process Type Segment Market Share Analysis, 2023 & 2035
FIGURE 11: Process Type Segment Market Size Forecast and Trend Analysis, 2024 to 2035 (USD Billion)
FIGURE 12: Automation Type Segment Market Share Analysis, 2023 & 2035
FIGURE 13: Automation Type Segment Market Size Forecast and Trend Analysis, 2024 to 2035 (USD Billion)
FIGURE 14: Process Type Segment Market Share Analysis, 2023 & 2035
FIGURE 15: Process Type Segment Market Size Forecast and Trend Analysis, 2024 to 2035 (USD Billion)
FIGURE 16: End-User Segment Market Share Analysis, 2023 & 2035
FIGURE 17: End-User Segment Market Size Forecast and Trend Analysis, 2024 to 2035 (USD Billion)
FIGURE 18: Regional Segment Market Share Analysis, 2023 & 2035
FIGURE 19: Regional Segment Market Size Forecast and Trend Analysis, 2024 to 2035 (USD Billion)
FIGURE 20: North America Agricultural Biological Market Share and Leading Players, 2024
FIGURE 21: Europe Lab Automation Market Share and Leading Players, 2024
FIGURE 22: Asia Pacific Lab Automation Market Share and Leading Players, 2024
FIGURE 23: Latin America Lab Automation Market Share and Leading Players, 2024
FIGURE 24: Middle East and Africa Lab Automation Market Share and Leading Players, 2024
FIGURE 25: North America Market Share Analysis by Country, 2024
FIGURE 26: U.S. Lab Automation Market Size, Forecast and Trend Analysis, 2024 to 2035 (USD Billion)
FIGURE 27: Canada Lab Automation Market Size, Forecast and Trend Analysis, 2024 to 2035 (USD Billion)
FIGURE 28: Mexico Lab Automation Market Size, Forecast and Trend Analysis, 2024 to 2035 (USD Billion)
FIGURE 29: Europe Lab Automation Market Share Analysis by Country, 2023
FIGURE 30: Germany Lab Automation Market Size, Forecast and Trend Analysis, 2024 to 2035 (USD Billion)
FIGURE 31: Spain Lab Automation Market Size, Forecast and Trend Analysis, 2024 to 2035 (USD Billion)
FIGURE 32: Italy Lab Automation Market Size, Forecast and Trend Analysis, 2024 to 2035 (USD Billion)
FIGURE 33: France Lab Automation Market Size, Forecast and Trend Analysis, 2024 to 2035 (USD Billion)
FIGURE 34: UK Lab Automation Market Size, Forecast and Trend Analysis, 2024 to 2035 (USD Billion)
FIGURE 35: Russia Lab Automation Market Size, Forecast and Trend Analysis, 2024 to 2035 (USD Billion)
FIGURE 36: Poland Lab Automation Market Size, Forecast and Trend Analysis, 2024 to 2035 (USD Billion)
FIGURE 37: Rest of Europe Lab Automation Market Size, Forecast and Trend Analysis, 2024 to 2035 (USD Billion)
FIGURE 38: Asia Pacific Lab Automation Market Share Analysis by Country, 2023
FIGURE 39: India Lab Automation Market Size, Forecast and Trend Analysis, 2024 to 2035 (USD Billion)
FIGURE 40: China Lab Automation Market Size, Forecast and Trend Analysis, 2024 to 2035 (USD Billion)
FIGURE 41: Japan Lab Automation Market Size, Forecast and Trend Analysis, 2024 to 2035 (USD Billion)
FIGURE 42: South Korea Lab Automation Market Size, Forecast and Trend Analysis, 2024 to 2035 (USD Billion)
FIGURE 43: Australia Lab Automation Market Size, Forecast and Trend Analysis, 2024 to 2035 (USD Billion)
FIGURE 44: Rest of APAC Lab Automation Market Size, Forecast and Trend Analysis, 2024 to 2035 (USD Billion)
FIGURE 45: Latin America Lab Automation Market Size, Forecast and Trend Analysis, 2024 to 2035 (USD Billion)
FIGURE 46: Latin America Lab Automation Market Share Analysis by Country, 2023
FIGURE 47: Brazil Lab Automation Market Size, Forecast and Trend Analysis, 2024 to 2035 (USD Billion)
FIGURE 48: Argentina Lab Automation Market Size, Forecast and Trend Analysis, 2024 to 2035 (USD Billion)
FIGURE 49: Colombia Lab Automation Market Size, Forecast and Trend Analysis, 2024 to 2035 (USD Billion)
FIGURE 50: Rest of LATAM Lab Automation Market Size, Forecast and Trend Analysis, 2024 to 2035 (USD Billion)
FIGURE 51: Middle East and Africa Lab Automation Market Size, Forecast and Trend Analysis, 2024 to 2035 (USD Billion)
FIGURE 52: Middle East and Africa Lab Automation Market Share Analysis by Country, 2023
FIGURE 53: GCC Countries (Saudi Arabia, UAE, Qatar, Kuwait, Oman, Bahrain) Lab Automation Market Size, Forecast and Trend Analysis, 2024 to 2035 (USD Billion)
FIGURE 54: Israel Lab Automation Market Size, Forecast and Trend Analysis, 2024 to 2035 (USD Billion)
FIGURE 55: Turkey Lab Automation Market Size, Forecast and Trend Analysis, 2024 to 2035 (USD Billion)
FIGURE 56: Egypt Lab Automation Market Size, Forecast and Trend Analysis, 2024 to 2035 (USD Billion)
FIGURE 57: Rest of MEA Lab Automation Market Size, Forecast and Trend Analysis, 2024 to 2035 (USD Billion)
- "The Lab Automation Market Research Report was instrumental in guiding our investment in next-generation automated sample processing systems. The detailed segmentation by technology and end-user application helped us identify the fastest-growing niches, while the competitive landscape analysis gave us a clear view of where to position ourselves. The report’s mix of market data, regulatory insights, and cost-benefit considerations allowed us to make a board-level decision with confidence, knowing we were aligned with both market demand and compliance requirements."
- Michael Turner, Director of Operations, Boston, USA
- "What impressed me most about this report was the depth of its primary research and how it linked market forecasts to practical lab workflow outcomes. We used its projections on automated liquid handling systems to prioritize our procurement strategy, avoiding costly over-investment in technologies nearing saturation. The case studies on integration challenges and solutions in European labs were particularly relevant, enabling us to prepare for potential bottlenecks before implementation. This is not just data, it’s actionable intelligence."
- Dr. Elisa Moreau, Head of R&D Strategy, Lyon, France
- "In Japan’s highly competitive diagnostics sector, precision and efficiency are critical. The Lab Automation Market Research Report provided a comprehensive view of emerging trends in robotics-driven sample preparation and AI-powered quality control. The insights on vendor capabilities and scalability factors directly influenced our vendor shortlist, saving months of internal research. The regional analysis for Asia-Pacific helped us forecast demand and justify budget allocations to senior management. This report is now a reference document for our long-term automation strategy."
- Kenji Watanabe, Senior Procurement Manager, Tokyo, Japan
The Lab Automation Market 2025 report has been prepared by a dedicated team of healthcare market intelligence specialists with over a decade of experience in analyzing laboratory technologies, automation trends, and healthcare innovation pipelines. Our analysts combine deep domain expertise in biomedical engineering, diagnostics workflow optimization, and AI-driven laboratory systems with proven research methodologies to deliver insights that help stakeholders make precise, data-backed decisions.
This report draws upon extensive primary interviews with industry executives, technology developers, procurement managers, and regulatory experts across North America, Europe, and Asia-Pacific, ensuring a truly global perspective. By blending robust quantitative market forecasting with qualitative insights from real-world lab environments, it provides decision-makers with not only what the market looks like but also why certain trends are emerging and how to act on them.
From identifying high-growth segments in automated liquid handling systems to evaluating scalability challenges in robotics-driven sample preparation, the Lab Automation Market 2025 report equips R&D leaders, procurement strategists, and investment teams with actionable intelligence to improve ROI, reduce operational risk, and stay ahead in a competitive landscape.
Our commitment to accuracy, relevance, and strategic applicability is why global healthcare organizations rely on our research as a cornerstone for long-term planning. To explore our expertise further and connect with our analyst team, visit our company LinkedIn page.