Market Outlook
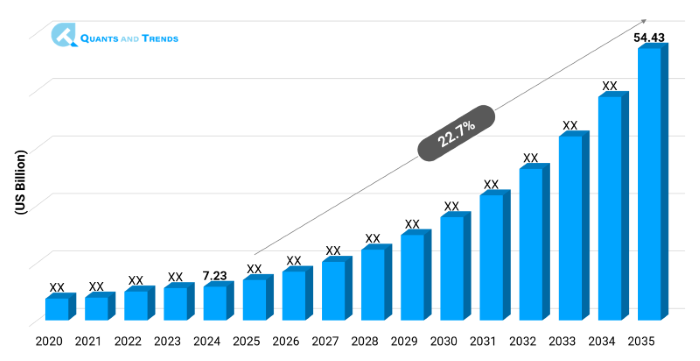
The global Digital Therapeutics market was valued at approximately USD 7.23 billion in 2024 and is projected to grow at a compound annual growth rate (CAGR) of 22.7% from 2025 to 2035, reaching around USD 54.43 billion by the end of the forecast period. The historical analysis starts from 2020 to 2023 with 2024 as the base year and forecasts starts from 2025 to 2035.
Digital Therapeutics Market is an emerging field that is expected to take center stage in the contemporary healthcare ecosystem due to the combination of software, AI, and evidence-based medicine. These online therapies offer clinically tested treatment plans of chronic illnesses that include diabetes, depression, insomnia, substance-use disorders. Digital therapeutics are becoming more popular as scalable and even person-specific solutions as efforts to focus on prevention and personalized care within healthcare systems grow.
The Digital Therapeutics are predicted to grow even faster due to the rise in smartphone penetration, new reimbursement schemes, and physician acceptance as per the recent Digital Therapeutics Market Forecast. Also, the introduction of new technologies and increased technology use in digital therapeutics and wearable devices are making it possible to monitor in real-time and deliver therapies accordingly. The leader of the adoption is North America, and the pace has been demonstrated by Asia-Pacific region growth that drives by health tech innovation and digital infrastructure expansion.
| Base Year | 2024 |
|---|---|
| Forecast Period | 2025-2035 |
| Historical Period | 2020-2023 |
| CAGR | 22.7% |
| Market Value In 2024 | USD 7.23 billion |
| Market Value In 2035 | USD 54.43 billion |
Introduction
Digital therapeutics (DTx) Digital therapeutics (DTx) are software-based, evidence-based therapeutic interventions aimed at preventing, treating, or managing a medical condition. In contrast to wellness apps, they are clinically proven (usually prescribed or used in addition to prescription), and such apps are sometimes presented as alternatives to medications. Digital Therapeutics Market is cutting across its stride with the increasing need to manage chronic ailments and mental illnesses at the most affordable cost. DTx solutions fall under regulations of medical devices, are under strict clinical validation procedures. With optimistic policies and the increasing level of digital health literacy, these treatments are broadening access to care and alleviating the pressure on the traditional healthcare models.
Key Market Drivers: What’s Fueling the Digital Therapeutics Market Boom?
- Patent Expiry of Major Biologics: The patent expiry of the blockbuster biologics like the humira, Herceptin, and Remicade is one of the major growth drivers of the digital therapeutics market. With these patents hitting expiration, the race is on among manufacturers to launch their Digital Therapeuticss in order to grab market share and provide cheaper versions. The trend is redefining treatment models and fostering competition among biology and reference drug manufacturers.
- Increasing Demand in Low-Cost Biologic Therapies: Biologics revolutionized the world of disease treatment yet are quite costly. Digital Therapeuticss are quite affordable and do not take away the effectiveness. Policymakers, as governments want to control spending on healthcare, and the likes of the private insurers want to cut their expenses on health treatment, have to take Digital Therapeuticss into consideration as a vital part of regulation. They are also cost-effective which provides wider patient access to important treatments, especially in oncology and immunology with high market size and share development in Digital Therapeutics industry across the world.
Note: Charts and figures are illustrative only. Contact us for verified market data.
Innovation in Focus: How Manufacturers Are Raising the Bar?
Digital Therapeutics has innovated care delivery in rethinking the clinical grade software combined with personalized interventions. Coders are using machine learning, natural language processing and real world evidence to help boost therapeutic effectiveness. Besides, there are advances through gamification, adaptive learning, and digital coaching in patient engagement, which positively affect outcomes. Innovation remains one of the fundamental distinguishing factors as R&D continues to increase global accessibility and effectiveness of digital therapeutics.
Recent Developments:
In March 2025, Click Therapeutics formed a collaboration with Otsuka Pharmaceuticals to co-develop a DTx to treat major depressive disorder, its second addition to the neuropsychiatry pipeline.
Conclusion
The Digital Therapeutics Market will revolutionize healthcare in the world by offering effective and cost-effective remedies that will be accessible and clinically viable. The market is demanding an increased number of solutions to treat chronic conditions and mental health as people need to deal with them and DTx is a fast-developing solution. The market has high levels of potential investment opportunities in digital therapeutics directly supported by regulation, payer adoption, and digital innovation. DTx will be part of a value-based care because real-world evidence increases credibility. Long-term success will be characterized by relentless innovation, customized interaction, and integration by larger healthcare ecosystems, placing digital therapeutics market size and share on the path toward sustained growth around the world.
Related Reports
- The global Wearable Health Technology Market is anticipated to reach approximately USD 394.5 billion by 2035 growing at a CAGR of 16.5% from 2024 by USD 75.6 billion.
- The global Chronic Disease Management Market is projected to reach approximately USD 22.1 billion by 2035 growing at a CAGR of 12.5% from 2024 by USD 5.59 billion.
Key Market Players
The competition state in digital therapeutics is changing as there is a balance of established healthcare companies with more technology-focused startups. The major approaches would be clinical partnerships, product introductions, geographic expansion. To acquire the trust of the market, businesses are focusing on the FDA and CE approvals, data protection and evidenced-based results. There is also an increase in mergers and acquisitions with the aim of gaining both ends of the digital health-related capabilities. The market is very competitive yet immature which provides sufficient space to innovate and consolidate. The future of the industry seems to be determined by strategic partnerships of pharma companies and DTx companies, as digital therapeutics are an essential element of the value-based care models easily found in various countries. Some of the key players in the Digital Therapeutics industry are as:
Omada Health, Pear Therapeutics, Propeller Health, Click Therapeutics, Akili Interactive, Big Health, Welldoc, Kaia Health, Voluntis, Biofourmis, Happify Health, Cognoa, MindMaze, Better Therapeutics, Noom Inc.

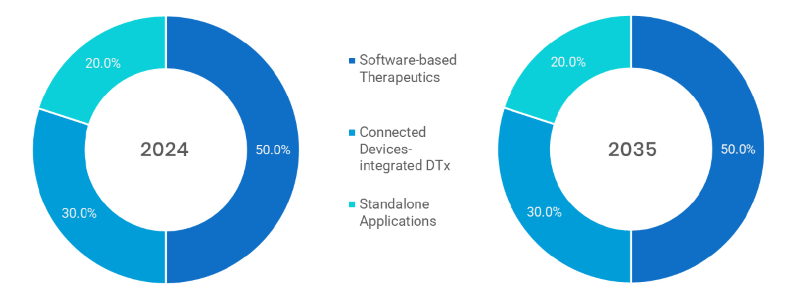
- Software based (Dominated): Therapeutics are either app or web-based and provide clinically-validated treatment. Their mode of access, scaling, and ability to connect with smartphones makes them dominate the market.
- Connected Devices-integrated DTx (fastest): This category comprises digital therapeutics integration with wearable computing devices such as fitness trackers or glucose monitors and gives personalized, real-time outputs. It is the fastest advancing one because of the increased use of technology.
- Standalone Applications: Standalone DTx apps operate independently without requiring integration with devices or wearables. They are popular for simple behavioral therapies and self-guided mental health interventions.
Note: Charts and figures are illustrative only. Contact us for verified market data.
Segmentation By Application
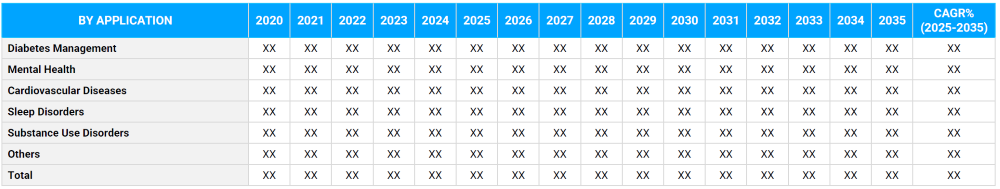
- Diabetes Management (dominated): Diabetes management with DTx platforms has the ability to manage glucose levels, remind clients to take medication, and work on coaching a lifestyle. It is supported clinically and by insurers and thus it heads the application segment.
- Mental Health (Fastest): Depression, anxiety, and PTSD are handled through such programs in the implementation of CBT and online coaches. The category chip is growing at a rapid pace due to the awareness and need of mental health post-pandemic.
- Cardiovascular Diseases: Interventions provided through digital products in this category include blood pressure control and monitoring of the heart rate in an attempt to control hypertension, post-surgery rehabilitation activities and prevention routines.
- Sleep Disorders: DTx against insomnia and sleep apnea offers CBT based modules and sleep monitoring. They are more commonly used and favored over medications to accomplish long-term non-invasive treatment.
- Substance Use Disorders: These platforms are used to recover addition through cognitive therapy, reminders and online peer support. With them, one may emancipate safe and convenient therapy without the stigma of the face-to-face program.
- Others: This comprises pain, gastrointestinal and respiratory DTx. They are specialist but expanding bespoke markets buoyed by the need to find safe, custom software solutions to an alternative to drugs.
Note: Charts and figures are illustrative only. Contact us for verified market data.
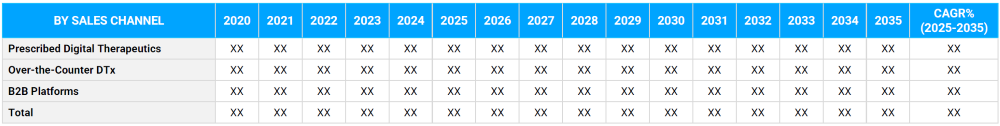
- Prescribed Digital Therapeutics (Dominated): These are prescribed, FDA-approved, platforms designed into conventional care. The presence of clinical validation and coverage are the keys to their dominance in the market.
- Over-the-Counter DTx: OTC DTx means are available over-the-counter without prescriptions. They are regularly utilized in the lifestyle enhancement and medicines to manage stress, as well as prevention, yet there is an increasing need of users.
- B2B Platforms (Payers, Employers, Providers) (Fastest): These platforms are sold to insurers, providers, or employers and are employee-wellness centric, chronic care-focused. These are fast growing as components of corporate health plans.
Note: Charts and figures are illustrative only. Contact us for verified market data.
- Patients (Dominated): Patients will be the primary users performing the care of taking care of themselves, behavioral therapy, and chronic care using DTx. The segment is the core area of market expansion because of great involvement.
- Healthcare Providers: DTx enables remote surveillance and integrations of care, enabling doctors and clinics to deliver care more effectively when it comes to patient outcomes and greater clinical efficiency especially in cases involving chronic and mental health.
- Payers & Insurers (Fastest): This group uses DTx to limit the overall healthcare costs through a reduction in long term health costs via any preventative care/behavioral modification program and typically presents bundled DTx a part of reimbursement programs or wellness packages.
- Employers: Corporates use DTx to enhance employee wellness, reduce absenteeism, and support mental health programs. The segment is growing rapidly with rising focus on workplace well-being.
Note: Charts and figures are illustrative only. Contact us for verified market data.
Segmentation By Region
Where the Market is Growing Fastest?
The Digital Therapeutics Market in North America represents the largest revenue share since it is early in regulatory acceptance, has well developed payer networks, and carries high adoption of digital health. It has the first FDA-cleared DTx and payer coverage across large health insurers in the U.S. market. Meantime, Asia-Pacific is the leading location in terms of developing the fastest, driven by tech-enabled healthcare models in India, China and South Korea. Demand is accelerating due to government-initiated digital health programs in the region as well as increasing burdens of chronic diseases. Europe is increasingly growing and the highly favorable reimbursement environments such as the DiGA program in Germany or the trialist DTx project in France are making more regulated digital therapies available to patients.
The following nations and regions will be covered in the report:
• North America: U.S., Canada and Mexico
• Asia Pacific: China, India, Japan, South Korea, Australia, among others
• Europe: Germany, France, Italy, Spain, UK, Russia, Rest of Europe
• Latin America: Brazil, Argentina, Colombia
• Middle East & Africa: Saudi Arabia, UAE, South Africa, Israel, Turkey
Note: Charts and figures are illustrative only. Contact us for verified market data.
1. Digital Therapeutics Market: Market Introduction & Context
1.1. Market Definition
1.2. Scope of the Study
1.3. Research Methodology
1.3.1. Primary Data Collection
1.3.2. Secondary Data Sourcing
1.3.3. External Industry Collaborations
1.3.4. In-House Research Databases
1.3.5. Analytical Frameworks & Forecasting End Users
1.3.6. Data Validation and Final Report Publishing
1.4. Key Assumptions
1.5. Market Ecosystem Overview
1.6. Stakeholder Analysis (Manufacturers, Suppliers, Growers, Distributors, Retailers)
(introduces the report’s scope, methodology, and assumptions to help the client clearly understand the study's coverage, data sources, and reliability)
2. Digital Therapeutics Market: Executive Summary
2.1. Key Insights & Market Snapshots
2.2. Analyst Viewpoint
2.3. Market Attractiveness Index
(offers a brief yet insightful market summary, giving the client a quick grasp of key trends, market potential, and strategic highlights)
3. Digital Therapeutics Market: Market Dynamics & Outlook
3.1. Drivers and their impact analysis
3.2. Restraints and their impact analysis
3.3. Opportunities and their impact analysis (Emerging Markets, New Product Categories)
3.4. Patent & Innovation Analysis (2020–2024)
(explains the major drivers, restraints, opportunities, and challenges shaping the market, enabling the client to assess both growth prospects and potential risks)
4. Digital Therapeutics Market: Market Environment & Industry
4.1. PESTEL Analysis
4.1.1. Political
4.1.2. Economic
4.1.3. Social
4.1.4. Technological
4.1.5. Environmental
4.1.6. Legal
4.2. Porter’s Five Forces Analysis
4.2.1. Threat of New Entrants
4.2.2. Bargaining Power of Buyers
4.2.3. Bargaining Power of Suppliers
4.2.4. Substitution Risk
4.2.5. Competitive Rivalry
4.3. Pricing Trend Analysis by Region (2024–2030)
4.4. Value Chain & Supply Chain Analysis
4.5. Impact of Digitalization
4.6. Product Type & Innovation Landscape
4.7. Regulatory Framework Analysis
4.7.1. Global & Regional Regulations
4.7.1.1. North America
4.7.1.2. Europe
4.7.1.3. APAC
4.7.1.4. LATAM
4.7.1.5. MEA
4.8. Import/Export Restrictions & Tariff Impact
4.9. Government Initiatives
4.10. Impact of Escalating Geopolitical Tensions
(provides an overview of the industry landscape, covering market dynamics, technological advancements, pricing trends, and regulatory influences for informed decision-making)
5. Digital Therapeutics Market – By Product Type
5.1. Overview
5.1.1. Segment Share Analysis, By Product Type, 2024 & 2035 (%)
5.1.2. Software-based Therapeutics
5.1.3. Connected Devices-integrated DTx
5.1.4. Standalone Applications
(presents market segmentation By Product Type, guiding the client on the product categories that are expected to drive demand and shape future revenue streams)
6. Digital Therapeutics Market – By Application
6.1. Overview
6.1.1. Segment Share Analysis, By Application, 2024 & 2035 (%)
6.1.2. Diabetes Management
6.1.3. Mental Health
6.1.4. Cardiovascular Diseases
6.1.5. Sleep Disorders
6.1.6. Substance Use Disorders
6.1.7. Others
(breaks down the market by Application, assisting the client in identifying material or origin preferences and emerging growth segments)
7. Digital Therapeutics Market – By Sales Channel
7.1. Overview
7.1.1. Segment Share Analysis, By Sales Channel, 2024 & 2035 (%)
7.1.2. Prescribed Digital Therapeutics
7.1.3. Over-the-Counter DTx
7.1.4. B2B Platforms
(focuses on market segmentation by Sales Channel, helping the client prioritize specific Sales Channels or end-use areas that offer significant business opportunities)
8. Digital Therapeutics Market – By End User
8.1. Overview
8.1.1. Segment Share Analysis, By End User, 2024 & 2035 (%)
8.1.2. Patients
8.1.3. Healthcare Providers
8.1.4. Payers & Insurers
8.1.5. Employers
(describes the market division by End User of Product Type, enabling the client to understand which usage methods are preferred and where future demand may rise)
9. Digital Therapeutics Market– By Geography
9.1. Introduction
9.1.1. Segment Share Analysis, By Geography, 2024 & 2035 (%)
9.2. North America
9.2.1. Regional Overview & Trends
9.2.2. Digital Therapeutics Key Manufacturers in North America
9.2.3. North America Market Size and Forecast, By Country, 2024 - 2035 (US$ Million)
9.2.4. North America Market Size and Forecast, By Product Type, 2024 - 2035 (US$ Million)
9.2.5. North America Market Size and Forecast, By Application, 2024 - 2035 (US$ Million)
9.2.6. North America Market Size and Forecast, By Sales Channel, 2024 - 2035 (US$ Million)
9.2.7. North America Market Size and Forecast, By End User, 2024 - 2035 (US$ Million)
9.2.8. U.S.
9.2.8.1. Overview
9.2.8.2. U.S. Market Size and Forecast, By Product Type, 2024 - 2035 (US$ Million)
9.2.8.3. U.S. Market Size and Forecast, By Application, 2024 - 2035 (US$ Million)
9.2.8.4. U.S. Market Size and Forecast, By Sales Channel, 2024 - 2035 (US$ Million)
9.2.8.5. U.S. Market Size and Forecast, By End User, 2024 - 2035 (US$ Million)
9.2.9. Canada
9.2.9.1. Overview
9.2.9.2. Canada Market Size and Forecast, By Product Type, 2024 - 2035 (US$ Million)
9.2.9.3. Canada Market Size and Forecast, By Application, 2024 - 2035 (US$ Million)
9.2.9.4. Canada Market Size and Forecast, By Sales Channel, 2024 - 2035 (US$ Million)
9.2.9.5. Canada Market Size and Forecast, By End User, 2024 - 2035 (US$ Million)
9.2.10. Mexico
9.2.10.1. Overview
9.2.10.2. Mexico Market Size and Forecast, By Product Type, 2024 - 2035 (US$ Million)
9.2.10.3. Mexico Market Size and Forecast, By Application, 2024 - 2035 (US$ Million)
9.2.10.4. Mexico Market Size and Forecast, By Sales Channel, 2024 - 2035 (US$ Million)
9.2.10.5. Mexico Market Size and Forecast, By End User, 2024 - 2035 (US$ Million)
Note: Similar information and analysis will be provided for all other regions (Europe, APAC, LATAM and MEA) and countries listed in the subsequent sections.
9.3. Europe
9.3.1. Germany
9.3.2. Italy
9.3.3. United Kingdom
9.3.4. France
9.3.5. Russia
9.3.6. Poland
9.3.7. Rest of Europe
9.4. Asia Pacific (APAC)
9.4.1. India
9.4.2. China
9.4.3. Japan
9.4.4. South Korea
9.4.5. Australia
9.4.6. Rest of APAC
9.5. Latin America
9.5.1. Brazil
9.5.2. Argentina
9.5.3. Colombia
9.5.4. Rest of LATAM
9.6. Middle East and Africa
9.6.1. Israel
9.6.2. Turkey
9.6.3. Egypt
9.6.4. Rest of MEA
(delivers a detailed regional and country-level analysis, supporting the client in recognizing growth hotspots and strategically allocating resources across geographies)
10. Digital Therapeutics Market: Competitive Landscape & Company Profiles
10.1. Market Share Analysis (2024)
10.2. Company Positioning Matrix (Leaders, Innovators, Emerging Players)
10.3. Company Profiles (Key Players: Overview, Products, Strategies, Financials, Recent Developments)
10.3.1. Omada Health
10.3.2. Pear Therapeutics
10.3.3. Propeller Health
10.3.4. Click Therapeutics
10.3.5. Akili Interactive
10.3.6. Big Health
10.3.7. Welldoc
10.3.8. Kaia Health
10.3.9. Voluntis
10.3.10. Biofourmis
10.3.11. Happify Health
10.3.12. Cognoa
10.3.13. MindMaze
10.3.14. Better Therapeutics
10.3.15. Noom Inc.
10.3.16. Others
Note: All company profiles will include details under the standard heads mentioned in section 10.3 - Overview, Products, Strategies, Financials, and Recent Developments. We also offer customization of the company profiling section based on your specific requirements.
(provides an assessment of key competitors, market shares, and strategic developments, giving the client essential insights to benchmark against or collaborate with industry leaders)
11. Digital Therapeutics Market: Future Market Outlook (2025–2035)
11.1.1. Scenario Analysis (Optimistic, Realistic, Pessimistic)
11.1.2. Disruptive Technologies Impact
11.1.3. Emerging Business Trends
11.1.4. Business Opportunities for startups and existing players
(presents market forecasts and future outlook scenarios, preparing the client for upcoming trends, innovations, and potential shifts in market structure)
12. Digital Therapeutics Market: Strategic Recommendations
(offers strategic recommendations for various stakeholders, enabling the client to make informed business decisions that maximize growth and minimize risks)
13. Digital Therapeutics Market: Disclaimer
(states the report’s disclaimers and legal boundaries, ensuring the client understands the terms of use, limitations, and responsibilities associated with the report)
List of Tables
TABLE 1: List of Data Sources
TABLE 2: Market Drivers; Impact Analysis
TABLE 3: Market Restraints; Impact Analysis
TABLE 4: Digital Therapeutics Market: Product Type Snapshot (2024)
TABLE 5: Segment Dashboard; Definition and Scope, By Product Type
TABLE 6: Global Digital Therapeutics Market, By Product Type 2022–2035 (USD Billion)
TABLE 7: Digital Therapeutics Market: Application Snapshot (2024)
TABLE 8: Segment Dashboard; Definition and Scope, by Application
TABLE 9: Global Digital Therapeutics Market, by Application 2022–2035 (USD Billion)
TABLE 10: Digital Therapeutics Market: Sales Channel Snapshot (2024)
TABLE 11: Segment Dashboard; Definition and Scope, By Sales Channel
TABLE 12: Global Digital Therapeutics Market, by Sales Channel 2022–2035 (USD Billion)
TABLE 13: Digital Therapeutics Market: End User Snapshot (2024)
TABLE 14: Segment Dashboard; Definition and Scope, by End User
TABLE 15: Global Digital Therapeutics Market, by End User 2022–2035 (USD Billion)
TABLE 16: Digital Therapeutics Market: Regional Snapshot (2024)
TABLE 17: Segment Dashboard; Definition and Scope, by Region
TABLE 18: Global Digital Therapeutics Market, by Region 2022–2035 (USD Billion)
TABLE 19: Digital Therapeutics Market, by Country (NA), 2022–2035 (USD Billion)
TABLE 20: Digital Therapeutics Market, By Product Type (NA), 2022–2035 (USD Billion)
TABLE 21: Digital Therapeutics Market, by Application (NA), 2022–2035 (USD Billion)
TABLE 22: Digital Therapeutics Market, by Sales Channel (NA), 2024–2035 (USD Billion)
TABLE 23: Digital Therapeutics Market, by End User (NA), 2022–2035 (USD Billion)
TABLE 24: U.S. Digital Therapeutics Market, By Product Type, 2022–2035 (USD Billion)
TABLE 25: U.S. Digital Therapeutics Market, by Application, 2022–2035 (USD Billion)
TABLE 26: U.S. Digital Therapeutics Market, by Sales Channel, 2022–2035 (USD Billion)
TABLE 27: U.S. Digital Therapeutics Market, by End User, 2022–2035 (USD Billion)
TABLE 28: Canada Digital Therapeutics Market, By Product Type, 2022–2035 (USD Billion)
TABLE 29: Canada Digital Therapeutics Market, by Application, 2022–2035 (USD Billion)
TABLE 30: Canada Digital Therapeutics Market, by Sales Channel, 2022–2035 (USD Billion)
TABLE 31: Canada Digital Therapeutics Market, by End User, 2022–2035 (USD Billion)
TABLE 32: Mexico Digital Therapeutics Market, By Product Type, 2022–2035 (USD Billion)
TABLE 33: Mexico Digital Therapeutics Market, by Application, 2022–2035 (USD Billion)
TABLE 34: Mexico Digital Therapeutics Market, by Sales Channel, 2022–2035 (USD Billion)
TABLE 35: Mexico Digital Therapeutics Market, by End User, 2022–2035 (USD Billion)
TABLE 36: Digital Therapeutics Market, by Country (Europe), 2022–2035 (USD Billion)
TABLE 37: Digital Therapeutics Market, By Product Type (Europe), 2022–2035 (USD Billion)
TABLE 38: Digital Therapeutics Market, by Application (Europe), 2022–2035 (USD Billion)
TABLE 39: Digital Therapeutics Market, by Sales Channel(Europe), 2022–2035 (USD Billion)
TABLE 40: Digital Therapeutics Market, by End User (Europe), 2022–2035 (USD Billion)
TABLE 41: Germany Digital Therapeutics Market, By Product Type, 2022–2035 (USD Billion)
TABLE 42: Germany Digital Therapeutics Market, by Application, 2022–2035 (USD Billion)
TABLE 43: Germany Digital Therapeutics Market, by Sales Channel, 2022–2035 (USD Billion)
TABLE 44: Germany Digital Therapeutics Market, by End User, 2022–2035 (USD Billion)
TABLE 45: Italy Digital Therapeutics Market, By Product Type, 2022–2035 (USD Billion)
TABLE 46: Italy Digital Therapeutics Market, by Application, 2022–2035 (USD Billion)
TABLE 47: Italy Digital Therapeutics Market, by Sales Channel, 2022–2035 (USD Billion)
TABLE 48: Italy Digital Therapeutics Market, by End User, 2022–2035 (USD Billion)
TABLE 49: United Kingdom Digital Therapeutics Market, By Product Type, 2022–2035 (USD Billion)
TABLE 50: United Kingdom Digital Therapeutics Market, by Application, 2022–2035 (USD Billion)
TABLE 51: United Kingdom Digital Therapeutics Market, by Sales Channel, 2022–2035 (USD Billion)
TABLE 52: United Kingdom Digital Therapeutics Market, by End User, 2022–2035 (USD Billion)
TABLE 53: France Digital Therapeutics Market, By Product Type, 2022–2035 (USD Billion)
TABLE 54: France Digital Therapeutics Market, by Application, 2022–2035 (USD Billion)
TABLE 55: France Digital Therapeutics Market, by Sales Channel, 2022–2035 (USD Billion)
TABLE 56: France Digital Therapeutics Market, by End User, 2022–2035 (USD Billion)
TABLE 57: Russia Digital Therapeutics Market, By Product Type, 2022–2035 (USD Billion)
TABLE 58: Russia Digital Therapeutics Market, by Application, 2022–2035 (USD Billion)
TABLE 59: Russia Digital Therapeutics Market, By Product Type, 2022–2035 (USD Billion)
TABLE 60: Russia Digital Therapeutics Market, by End User, 2022–2035 (USD Billion)
TABLE 61: Poland Digital Therapeutics Market, by Sales Channel, 2022–2035 (USD Billion)
TABLE 62: Poland Digital Therapeutics Market, by Application, 2022–2035 (USD Billion)
TABLE 63: Poland Digital Therapeutics Market, by Sales Channel, 2022–2035 (USD Billion)
TABLE 64: Poland Digital Therapeutics Market, by End User, 2022–2035 (USD Billion)
TABLE 65: Rest of Europe Digital Therapeutics Market, By Product Type, 2022–2035 (USD Billion)
TABLE 66: Rest of Europe Digital Therapeutics Market, by Application, 2022–2035 (USD Billion)
TABLE 67: Rest of Europe Digital Therapeutics Market, by Sales Channel, 2022–2035 (USD Billion)
TABLE 68: Rest of Europe Digital Therapeutics Market, by End User, 2022–2035 (USD Billion)
TABLE 69: Digital Therapeutics Market, by Country (APAC), 2022–2035 (USD Billion)
TABLE 70: Digital Therapeutics Market, By Product Type (APAC), 2022–2035 (USD Billion)
TABLE 71: Digital Therapeutics Market, by Application (APAC), 2022–2035 (USD Billion)
TABLE 72: Digital Therapeutics Market, by Sales Channel(APAC), 2022–2035 (USD Billion)
TABLE 73: Digital Therapeutics Market, by End User (APAC), 2022–2035 (USD Billion)
TABLE 74: India Digital Therapeutics Market, By Product Type, 2022–2035 (USD Billion)
TABLE 75: India Digital Therapeutics Market, by Application, 2022–2035 (USD Billion)
TABLE 76: India Digital Therapeutics Market, by Sales Channel, 2022–2035 (USD Billion)
TABLE 77: India Digital Therapeutics Market, by End User, 2022–2035 (USD Billion)
TABLE 78: China Digital Therapeutics Market, By Product Type, 2022–2035 (USD Billion)
TABLE 79: China Digital Therapeutics Market, by Application, 2022–2035 (USD Billion)
TABLE 80: China Digital Therapeutics Market, by Sales Channel, 2022–2035 (USD Billion)
TABLE 81: China Digital Therapeutics Market, by End User, 2022–2035 (USD Billion)
TABLE 82: Japan Digital Therapeutics Market, By Product Type, 2022–2035 (USD Billion)
TABLE 83: Japan Digital Therapeutics Market, by Application, 2022–2035 (USD Billion)
TABLE 84: Japan Digital Therapeutics Market, by Sales Channel, 2022–2035 (USD Billion)
TABLE 85: Japan Digital Therapeutics Market, by End User, 2022–2035 (USD Billion)
TABLE 86: South Korea Digital Therapeutics Market, By Product Type, 2022–2035 (USD Billion)
TABLE 87: South Korea Digital Therapeutics Market, by Application, 2022–2035 (USD Billion)
TABLE 88: South Korea Digital Therapeutics Market, by Sales Channel, 2022–2035 (USD Billion)
TABLE 89: South Korea Digital Therapeutics Market, by End User, 2022–2035 (USD Billion)
TABLE 90: Australia Digital Therapeutics Market, By Product Type, 2022–2035 (USD Billion)
TABLE 91: Australia Digital Therapeutics Market, by Application, 2022–2035 (USD Billion)
TABLE 92: Australia Digital Therapeutics Market, by Sales Channel, 2022–2035 (USD Billion)
TABLE 93: Australia Digital Therapeutics Market, by End User, 2022–2035 (USD Billion)
TABLE 94: Rest of APAC Digital Therapeutics Market, By Product Type, 2022–2035 (USD Billion)
TABLE 95: Rest of APAC Digital Therapeutics Market, by Application, 2022–2035 (USD Billion)
TABLE 96: Rest of APAC Digital Therapeutics Market, by Sales Channel, 2022–2035 (USD Billion)
TABLE 97: Rest of APAC Digital Therapeutics Market, by End User, 2022–2035 (USD Billion)
TABLE 98: Brazil Digital Therapeutics Market, By Product Type, 2022–2035 (USD Billion)
TABLE 99: Brazil Digital Therapeutics Market, by Application, 2022–2035 (USD Billion)
TABLE 100: Brazil Digital Therapeutics Market, by Sales Channel, 2022–2035 (USD Billion)
TABLE 101: Brazil Digital Therapeutics Market, by End User, 2022–2035 (USD Billion)
TABLE 102: Argentina Digital Therapeutics Market, By Product Type, 2022–2035 (USD Billion)
TABLE 103: Argentina Digital Therapeutics Market, by Application, 2022–2035 (USD Billion)
TABLE 104: Argentina Digital Therapeutics Market, by Sales Channel, 2022–2035 (USD Billion)
TABLE 105: Argentina Digital Therapeutics Market, by End User, 2022–2035 (USD Billion)
TABLE 106: Colombia Digital Therapeutics Market, By Product Type, 2022–2035 (USD Billion)
TABLE 107: Colombia Digital Therapeutics Market, by Application, 2022–2035 (USD Billion)
TABLE 108: Colombia Digital Therapeutics Market, by Sales Channel, 2022–2035 (USD Billion)
TABLE 109: Colombia Digital Therapeutics Market, by End User, 2022–2035 (USD Billion)
TABLE 110: Rest of LATAM Digital Therapeutics Market, By Product Type, 2022–2035 (USD Billion)
TABLE 111: Rest of LATAM Digital Therapeutics Market, by Application, 2022–2035 (USD Billion)
TABLE 112: Rest of LATAM Digital Therapeutics Market, by Sales Channel, 2022–2035 (USD Billion)
TABLE 113: Rest of LATAM Digital Therapeutics Market, by End User, 2022–2035 (USD Billion)
TABLE 114: Israel Digital Therapeutics Market, By Product Type, 2022–2035 (USD Billion)
TABLE 115: Israel Digital Therapeutics Market, by Application, 2022–2035 (USD Billion)
TABLE 116: Israel Digital Therapeutics Market, by Sales Channel, 2022–2035 (USD Billion)
TABLE 117: Israel Digital Therapeutics Market, by End User, 2022–2035 (USD Billion)
TABLE 118: Turkey Digital Therapeutics Market, By Product Type, 2022–2035 (USD Billion)
TABLE 119: Turkey Digital Therapeutics Market, by Application, 2022–2035 (USD Billion)
TABLE 120: Turkey Digital Therapeutics Market, by Sales Channel, 2022–2035 (USD Billion)
TABLE 121: Turkey Digital Therapeutics Market, by End User, 2022–2035 (USD Billion)
TABLE 122: Egypt Digital Therapeutics Market, By Product Type, 2022–2035 (USD Billion)
TABLE 123: Egypt Digital Therapeutics Market, by Application, 2022–2035 (USD Billion)
TABLE 124: Egypt Digital Therapeutics Market, by Sales Channel, 2022–2035 (USD Billion)
TABLE 125: Egypt Digital Therapeutics Market, by End User, 2022–2035 (USD Billion)
TABLE 126: Rest of MEA Digital Therapeutics Market, By Product Type, 2022–2035 (USD Billion)
TABLE 127: Rest of MEA Digital Therapeutics Market, by Application, 2022–2035 (USD Billion)
TABLE 128: Rest of MEA Digital Therapeutics Market, by Sales Channel, 2022–2035 (USD Billion)
TABLE 129: Rest of MEA Digital Therapeutics Market, by End User, 2022–2035 (USD Billion)
List of Figures
FIGURE 1: Digital Therapeutics Market Segmentation
FIGURE 2: Market Research Methodology
FIGURE 3: Value Chain Analysis
FIGURE 4: PESTLE Analysis
FIGURE 5: Porter’s Five Forces Analysis
FIGURE 6: Market Attractiveness Analysis
FIGURE 7: Market Dynamics
FIGURE 8: Innovation & Patent Landscape (2020–2024)
FIGURE 9: Competitive Landscape; Key Company Market Share Analysis, 2023
FIGURE 10: Product Type Segment Market Share Analysis, 2023 & 2035
FIGURE 11: Product Type Segment Market Size Forecast and Trend Analysis, 2024 to 2035 (USD Billion)
FIGURE 12: Application Segment Market Share Analysis, 2023 & 2035
FIGURE 13: Application Segment Market Size Forecast and Trend Analysis, 2024 to 2035 (USD Billion)
FIGURE 14: Product Type Segment Market Share Analysis, 2023 & 2035
FIGURE 15: Product Type Segment Market Size Forecast and Trend Analysis, 2024 to 2035 (USD Billion)
FIGURE 16: End User Segment Market Share Analysis, 2023 & 2035
FIGURE 17: End User Segment Market Size Forecast and Trend Analysis, 2024 to 2035 (USD Billion)
FIGURE 18: Regional Segment Market Share Analysis, 2023 & 2035
FIGURE 19: Regional Segment Market Size Forecast and Trend Analysis, 2024 to 2035 (USD Billion)
FIGURE 20: North America Agricultural Biological Market Share and Leading Players, 2024
FIGURE 21: Europe Digital Therapeutics Market Share and Leading Players, 2024
FIGURE 22: Asia Pacific Digital Therapeutics Market Share and Leading Players, 2024
FIGURE 23: Latin America Digital Therapeutics Market Share and Leading Players, 2024
FIGURE 24: Middle East and Africa Digital Therapeutics Market Share and Leading Players, 2024
FIGURE 25: North America Market Share Analysis by Country, 2024
FIGURE 26: U.S. Digital Therapeutics Market Size, Forecast and Trend Analysis, 2024 to 2035 (USD Billion)
FIGURE 27: Canada Digital Therapeutics Market Size, Forecast and Trend Analysis, 2024 to 2035 (USD Billion)
FIGURE 28: Mexico Digital Therapeutics Market Size, Forecast and Trend Analysis, 2024 to 2035 (USD Billion)
FIGURE 29: Europe Digital Therapeutics Market Share Analysis by Country, 2023
FIGURE 30: Germany Digital Therapeutics Market Size, Forecast and Trend Analysis, 2024 to 2035 (USD Billion)
FIGURE 31: Spain Digital Therapeutics Market Size, Forecast and Trend Analysis, 2024 to 2035 (USD Billion)
FIGURE 32: Italy Digital Therapeutics Market Size, Forecast and Trend Analysis, 2024 to 2035 (USD Billion)
FIGURE 33: France Digital Therapeutics Market Size, Forecast and Trend Analysis, 2024 to 2035 (USD Billion)
FIGURE 34: UK Digital Therapeutics Market Size, Forecast and Trend Analysis, 2024 to 2035 (USD Billion)
FIGURE 35: Russia Digital Therapeutics Market Size, Forecast and Trend Analysis, 2024 to 2035 (USD Billion)
FIGURE 36: Poland Digital Therapeutics Market Size, Forecast and Trend Analysis, 2024 to 2035 (USD Billion)
FIGURE 37: Rest of Europe Digital Therapeutics Market Size, Forecast and Trend Analysis, 2024 to 2035 (USD Billion)
FIGURE 38: Asia Pacific Digital Therapeutics Market Share Analysis by Country, 2023
FIGURE 39: India Digital Therapeutics Market Size, Forecast and Trend Analysis, 2024 to 2035 (USD Billion)
FIGURE 40: China Digital Therapeutics Market Size, Forecast and Trend Analysis, 2024 to 2035 (USD Billion)
FIGURE 41: Japan Digital Therapeutics Market Size, Forecast and Trend Analysis, 2024 to 2035 (USD Billion)
FIGURE 42: South Korea Digital Therapeutics Market Size, Forecast and Trend Analysis, 2024 to 2035 (USD Billion)
FIGURE 43: Australia Digital Therapeutics Market Size, Forecast and Trend Analysis, 2024 to 2035 (USD Billion)
FIGURE 44: Rest of APAC Digital Therapeutics Market Size, Forecast and Trend Analysis, 2024 to 2035 (USD Billion)
FIGURE 45: Latin America Digital Therapeutics Market Size, Forecast and Trend Analysis, 2024 to 2035 (USD Billion)
FIGURE 46: Latin America Digital Therapeutics Market Share Analysis by Country, 2023
FIGURE 47: Brazil Digital Therapeutics Market Size, Forecast and Trend Analysis, 2024 to 2035 (USD Billion)
FIGURE 48: Argentina Digital Therapeutics Market Size, Forecast and Trend Analysis, 2024 to 2035 (USD Billion)
FIGURE 49: Colombia Digital Therapeutics Market Size, Forecast and Trend Analysis, 2024 to 2035 (USD Billion)
FIGURE 50: Rest of LATAM Digital Therapeutics Market Size, Forecast and Trend Analysis, 2024 to 2035 (USD Billion)
FIGURE 51: Middle East and Africa Digital Therapeutics Market Size, Forecast and Trend Analysis, 2024 to 2035 (USD Billion)
FIGURE 52: Middle East and Africa Digital Therapeutics Market Share Analysis by Country, 2023
FIGURE 53: GCC Countries (Saudi Arabia, UAE, Qatar, Kuwait, Oman, Bahrain) Digital Therapeutics Market Size, Forecast and Trend Analysis, 2024 to 2035 (USD Billion)
FIGURE 54: Israel Digital Therapeutics Market Size, Forecast and Trend Analysis, 2024 to 2035 (USD Billion)
FIGURE 55: Turkey Digital Therapeutics Market Size, Forecast and Trend Analysis, 2024 to 2035 (USD Billion)
FIGURE 56: Egypt Digital Therapeutics Market Size, Forecast and Trend Analysis, 2024 to 2035 (USD Billion)
FIGURE 57: Rest of MEA Digital Therapeutics Market Size, Forecast and Trend Analysis, 2024 to 2035 (USD Billion)
- "The Digital Therapeutics Market Research Report provided a depth of analysis we simply could not find elsewhere. The detailed segmentation by therapeutic area, paired with insights into regulatory frameworks and reimbursement policies, helped us identify viable market entry points in mental health and chronic disease applications. The competitive benchmarking section was particularly valuable, it allowed our team to refine our partnership strategy and avoid costly missteps. This report has directly influenced our 3-year product roadmap."
- Michael Torres, Senior Strategy Director, Digital Health Solutions, United States
- "As someone overseeing digital health adoption in multiple European markets, I found the country-specific policy analysis in this report to be outstanding. It clearly outlined the reimbursement pathways in Germany, France, and the Nordics, enabling us to align our launch strategy with markets showing the highest adoption potential. The integration of clinical evidence trends alongside commercial forecasts gave our executive team the confidence to accelerate investment in cognitive-behavioral therapy digital solutions. It’s rare to find market research that balances scientific rigor with actionable business intelligence, this one does."
- Dr. Emilia Novak, Head of Innovation Strategy, Healthcare Technology Division, Poland
- "The level of granularity in the Asia-Pacific analysis was exceptional. The report not only covered Japan’s unique regulatory environment but also provided comparative insights into South Korea, Singapore, and Australia. This helped us understand cross-border growth opportunities and anticipate upcoming compliance requirements. The section on digital therapeutics integration with national healthcare systems was particularly useful in framing our go-to-market pitch to local stakeholders. It’s an indispensable resource for anyone serious about scaling in APAC."
- Haruto Sakamoto, Director of Market Development, Digital Health Ventures, Japan
This Digital Therapeutics Market 2025 report is authored by a senior research team at Quants and Trends, a trusted provider of healthcare market intelligence with over a decade of experience in analyzing emerging trends, technologies, and investment opportunities in global health innovation. Our analysts combine deep domain expertise in digital health, therapeutic interventions, and healthcare policy with advanced market modeling techniques to deliver insights that stand up to both scientific scrutiny and boardroom decision-making.
Each data point in this report is backed by rigorous primary research, interviews with industry executives, healthcare providers, regulators, and technology innovators, alongside extensive secondary analysis of peer-reviewed studies, clinical trial databases, and regulatory filings. This dual-method approach ensures that every forecast, opportunity assessment, and competitive analysis in the report is not only credible but also directly applicable to strategic business planning.
Whether you are a healthcare technology startup exploring market entry, a pharmaceutical company considering partnerships in the digital therapeutics space, or an investor evaluating the next wave of healthtech innovations, this report equips you with the actionable intelligence needed to reduce risk, identify growth segments, and accelerate ROI.
Our commitment to accuracy, transparency, and real-world applicability has made our research a go-to resource for decision-makers across North America, Europe, and Asia-Pacific. To learn more about our expertise and connect with our analysts, visit our company LinkedIn page.