Market Outlook
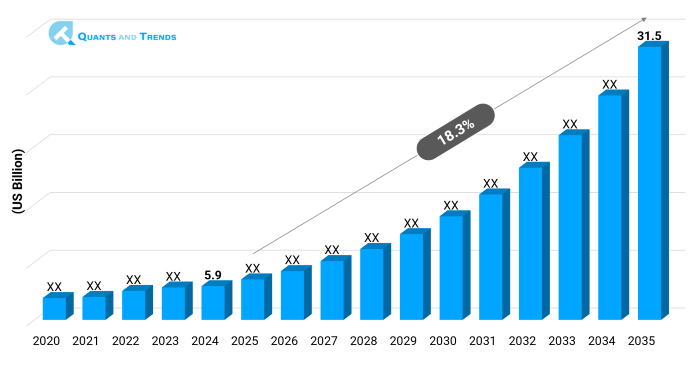
The global Next-Gen Smart Implants market was valued at approximately USD 5.9 billion in 2024 and is projected to grow at a compound annual growth rate (CAGR) of 18.3% from 2025 to 2035, reaching around USD 31.5 billion by the end of the forecast period. The historical analysis starts from 2020 to 2023 with 2024 as the base year and forecasts starts from 2025 to 2035.
The Next-Gen Smart Implants Market is undergoing a boom period as the healthcare systems merge high-tech digital health technology with implantable devices. The systems are equipped with sensors, wireless communication, and AI-driven analytics, which help to continuously monitor and provide real-time feedback. Adoption is being driven by the increasing demand of minimally invasive procedures and personalized treatments. North America is leading because of its high R&D investment and early adoption whereas Asian-pacific is turning out to be the most expanding region. Next-Gen Smart Implants Market Forecast reports that the growing focus on chronic disease treatment, aging, and the enhancement of connectivity solutions are key drivers of growth that are encouraged by the changing regulatory frameworks and positive reimbursement policies.
| Base Year | 2024 |
|---|---|
| Forecast Period | 2025-2035 |
| Historical Period | 2020-2023 |
| CAGR | 18.3% |
| Market Value In 2024 | USD 5.9 billion |
| Market Value In 2035 | USD 31.5 billion |
Introduction
The Next-Gen Smart Implants Market Report emphasizes the transition of conventional implants to intelligent, connected products that are able to track health indicators, improve patient safety, and hospital readmission. The implants are essential in the field of orthopedics, cardiovascular conditions, neurology, and dental practices as they combine biosensors with IoT-based systems. Some of the major trends that support the market in Next-Gen Smart Implants are remote patient monitoring, AI-based diagnostics, and micro-sized energy sources. As the emphasis on the concept of precision medicine and value-based care is increasing, smart implants develop into one of the pillars of modern healthcare and help merge medical technology and personalized treatment strategies.
Key Drivers: What’s Fueling the Next-Gen Smart Implants Market Boom?
- Increasing Chronic Disease Burden: The boom in cardiovascular diseases, diabetes and skeletal disorders has only hastened the need to explore new approaches to patient care. Smart implants help monitor key health indicators in real time, allowing to detect complications in time and avoid hospital visits. This force enhances the Next-Gen Smart Implants Market Size & Share prognosis since this matches global healthcare demands.
- Technology Adoption in Next-Gen Smart Implants: The field of microelectronics, nanotechnology and wireless communication are changing the possibilities of an implant. Advancements are enhancing functionality and patient experience, with orthopedic implants that have motion sensors, and heart implants that monitor arrhythmia. Improved connectivity with smartphones and cloud systems is also driving Next-Gen Smart Implants Industry Analysis and making it a popular adoption in both developed and emerging economies.
Note: Charts and figures are illustrative only. Contact us for verified market data.
Innovation in Focus: How Manufacturers Are Raising the Bar?
The Next-Gen Smart Implants Market focuses on the revolution of such aspects as bio-compatible materials, energy-saving sensors, and the analytics that can be conducted with the help of AI. The companies are inventing implants which adjust themselves in accordance with the physiology of the patient, offer predictive diagnostics, and connect with telemedicine systems. Future trends are biodegradable implants with inbuilt chips, wireless charging technology and adaptive neural implants. These innovations define the changing Next-Gen Smart Implants Competitive Landscape, whereby partnerships between medtech companies, AI developers and healthcare organizations guarantee ongoing product development and growth of personalized healthcare options.
Recent Developments:
Medtronic declared the introduction of a new generation of smart cardiac devices that combine AI-arrhythmia detection and wireless transmission of data to provide better patient monitoring.
Conclusion
The Next-Gen Smart Implants Market is a cross-function of healthcare, technology, and personalized medicine. Its use in orthopedics, cardiovascular healthcare, neurology and dentistry is on the rise and it finds more applications across the world. The most important growth opportunities are attributed to increasing prevalence of chronic diseases, enabling regulations and high rate of adoption of technologies in Next-Gen Smart Implants. North America is the best adopter with Asia-Pacific being the fastest growing market. The perspective also highlights long-term prospects in surveillance, medication administration, and the incorporation of AI. With an increase in emerging opportunities, the market offers groundbreaking healthcare advantages, transformative patient outcomes, and long-term medical technology ecosystem innovation.
Key Market Players
Collaborations, product launches, and strategic acquisitions are the features of the Next-Gen Smart Implants Competitive Landscape. The established medtech companies are in the forefront of innovation with AI integration, bio-compatible materials, and wireless connectivity solutions. Startups are bringing disruptive technologies to miniaturized sensors and cloud-based analytics. Collaborations with hospitals and research institutes enhance product validation and speed up commercialization. Some of the growth drivers and challenges faced by companies are compliance with regulations, cybersecurity risks, and high costs of R&D. However, sustained investment guarantees long-term prospects and market growth with international players capitalising on strategic partnerships as a way of ensuring competitive edge in this dynamic healthcare technology industry. Some of the key players in the Next-Gen Smart Implants industry are as:
Medtronic, Johnson & Johnson (DePuy Synthes), Zimmer Biomet, Abbott Laboratories, Boston Scientific Corporation, Stryker Corporation, Smith & Nephew, Biotronik SE, Straumann Group, Cochlear Ltd., NuVasive Inc., LivaNova PLC, Globus Medical Inc., NeuroPace Inc., Bioness Inc.

Segmentation By Type
- Orthopedic Smart Implants (Dominant): This technology is largely used in joint replacement and spine surgeries with an inbuilt motion and load sensors.
- Cardiac Smart Implants (Fastest-growing): The cardiac pacemakers and defibrillators have remote monitoring, and predictive AI features.
- Dental Smart Implants: It is applied in restorative dentistry, and it has real-time monitoring of infection and healing.
- Neurological and Other Implants: Specializes in neural stimulation, epilepsy monitoring and hearing restoration.
Segmentation By Application
- Orthopedics (Dominant): It has the highest prevalence of bone and joint disorders and that is why it has the highest share.
- Cardiovascular (Fastest-growing): Increasingly used to treat arrhythmia and heart failure.
- Dental: Good uptake of advanced oral rehabilitation.
- Neurology & Others: Used in the treatment of Parkinson, epilepsy, and chronic pain management.
- Hospitals (Dominant): The biggest portion as a result of full infrastructure and the use of advanced implants.
- Ambulatory Surgical Centers (Fastest-growing): Outpatient demand and cost-effective.
- Specialty Clinics: There is an increase in orthopedic, neurological, and dental clinics.
- Academic/ Research Institutes: Provide donations in the form of pilot activities and clinical trials.
Segmentation By Region
Where the Market is Growing Fastest?
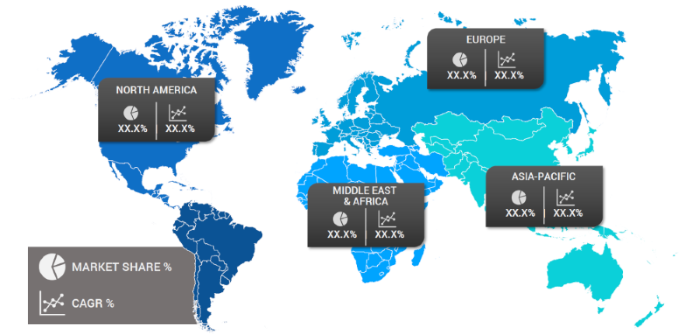
The Next-Gen Smart Implants Market Forecast indicates that North America is the most dominant region, which is due to high adoption rates, strong R&D support and regulation. Europe is the next in line with developed healthcare facilities and good reimbursement policies. In the meantime, the fastest-growing area is Asia-Pacific due to increasing healthcare spending, high numbers of patients, and government support in the use of technologies. The prospects are emerging in Latin America and the Middle East & Africa, which were assisted with the modernization of healthcare services. These insights at the regional level underline the global growth of smart implants, underpinned by the cross-border and emerging clinical trials along with the solid drive towards connected healthcare ecosystems around the globe.
The following nations and regions will be covered in the report:
• North America: U.S., Canada and Mexico
• Asia Pacific: China, India, Japan, South Korea, Australia, among others
• Europe: Germany, France, Italy, Spain, UK, Russia, Rest of Europe
• Latin America: Brazil, Argentina, Colombia
• Middle East & Africa: Saudi Arabia, UAE, South Africa, Israel, Turkey
Note: Charts and figures are illustrative only. Contact us for verified market data.
1. Next-Gen Smart Implants Market: Market Introduction & Context
1.1. Market Definition
1.2. Scope of the Study
1.3. Research Methodology
1.3.1. Primary Data Collection
1.3.2. Secondary Data Sourcing
1.3.3. External Industry Collaborations
1.3.4. In-House Research Databases
1.3.5. Analytical Frameworks & Forecasting End users
1.3.6. Data Validation and Final Report Publishing
1.4. Key Assumptions
1.5. Market Ecosystem Overview
1.6. Stakeholder Analysis (Manufacturers, Suppliers, Growers, Distributors, Retailers)
(introduces the report’s scope, methodology, and assumptions to help the client clearly understand the study's coverage, data sources, and reliability)
2. Next-Gen Smart Implants Market: Executive Summary
2.1. Key Insights & Market Snapshots
2.2. Analyst Viewpoint
2.3. Market Attractiveness Index
(offers a brief yet insightful market summary, giving the client a quick grasp of key trends, market potential, and strategic highlights)
3. Next-Gen Smart Implants Market: Market Dynamics & Outlook
3.1. Drivers and their impact analysis
3.2. Restraints and their impact analysis
3.3. Opportunities and their impact analysis (Emerging Markets, New Product Categories)
3.4. Patent & Innovation Analysis (2020–2024)
(explains the major drivers, restraints, opportunities, and challenges shaping the market, enabling the client to assess both growth prospects and potential risks)
4. Next-Gen Smart Implants Market: Market Environment & Industry
4.1. PESTEL Analysis
4.1.1. Political
4.1.2. Economic
4.1.3. Social
4.1.4. Technological
4.1.5. Environmental
4.1.6. Legal
4.2. Porter’s Five Forces Analysis
4.2.1. Threat of New Entrants
4.2.2. Bargaining Power of Buyers
4.2.3. Bargaining Power of Suppliers
4.2.4. Substitution Risk
4.2.5. Competitive Rivalry
4.3. Pricing Trend Analysis by Region (2024–2030)
4.4. Value Chain & Supply Chain Analysis
4.5. Impact of Digitalization
4.6. Type & Innovation Landscape
4.7. Regulatory Framework Analysis
4.7.1. Global & Regional Regulations
4.7.1.1. North America
4.7.1.2. Europe
4.7.1.3. APAC
4.7.1.4. LATAM
4.7.1.5. MEA
4.8. Import/Export Restrictions & Tariff Impact
4.9. Government Initiatives
4.10. Impact of Escalating Geopolitical Tensions
(provides an overview of the industry landscape, covering market dynamics, technological advancements, pricing trends, and regulatory influences for decision-making)
5. Next-Gen Smart Implants Market – By Type
5.1. Overview
5.1.1. Segment Share Analysis, By Type, 2024 & 2035 (%)
5.1.2. Orthopedic Smart Implants
5.1.3. Cardiac Smart Implants
5.1.4. Dental Smart Implants
5.1.5. Neurological and Other Implants
(presents market segmentation By Type, guiding the client on the product categories that are expected to drive demand and shape future revenue streams)
6. Next-Gen Smart Implants Market – End Use
6.1. Overview
6.1.1. Segment Share Analysis, End Use, 2024 & 2035 (%)
6.1.2. Hospitals
6.1.3. Ambulatory Surgical Centers
6.1.4. Specialty Clinics
6.1.5. Academic/ Research Institutes
(breaks down the market End Use, assisting the client in identifying material or origin preferences and emerging growth segments)
7. Next-Gen Smart Implants Market – By Application
7.1. Overview
7.1.1. Segment Share Analysis, By Application, 2024 & 2035 (%)
7.1.2. Orthopedics
7.1.3. Cardiovascular
7.1.4. Dental
7.1.5. Neurology & Others
(focuses on market segmentation by Application, helping the client prioritize specific Applications or end-use areas that offer significant business opportunities)
8. Next-Gen Smart Implants Market– By Geography
8.1. Introduction
8.1.1. Segment Share Analysis, By Geography, 2024 & 2035 (%)
8.2. North America
8.2.1. Regional Overview & Trends
8.2.2. Next-Gen Smart Implants Key Manufacturers in North America
8.2.3. North America Market Size and Forecast, By Country, 2024 - 2035 (US$ Million)
8.2.4. North America Market Size and Forecast, By Type, 2024 - 2035 (US$ Million)
8.2.5. North America Market Size and Forecast, End Use, 2024 - 2035 (US$ Million)
8.2.6. North America Market Size and Forecast, By Application, 2024 - 2035 (US$ Million)
8.2.7. U.S.
8.2.7.1. Overview
8.2.7.2. U.S. Market Size and Forecast, By Type, 2024 - 2035 (US$ Million)
8.2.7.3. U.S. Market Size and Forecast, End Use, 2024 - 2035 (US$ Million)
8.2.7.4. U.S. Market Size and Forecast, By Application, 2024 - 2035 (US$ Million)
8.2.8. Canada
8.2.8.1. Overview
8.2.8.2. Canada Market Size and Forecast, By Type, 2024 - 2035 (US$ Million)
8.2.8.3. Canada Market Size and Forecast, End Use, 2024 - 2035 (US$ Million)
8.2.8.4. Canada Market Size and Forecast, By Application, 2024 - 2035 (US$ Million)
8.2.9. Mexico
8.2.9.1. Overview
8.2.9.2. Mexico Market Size and Forecast, By Type, 2024 - 2035 (US$ Million)
8.2.9.3. Mexico Market Size and Forecast, End Use, 2024 - 2035 (US$ Million)
8.2.9.4. Mexico Market Size and Forecast, By Application, 2024 - 2035 (US$ Million)
Note: Similar information and analysis will be provided for all other regions (Europe, APAC, LATAM and MEA) and countries listed in the subsequent sections.
8.3. Europe
8.3.1. Germany
8.3.2. Italy
8.3.3. United Kingdom
8.3.4. France
8.3.5. Russia
8.3.6. Poland
8.3.7. Rest of Europe
8.4. Asia Pacific (APAC)
8.4.1. India
8.4.2. China
8.4.3. Japan
8.4.4. South Korea
8.4.5. Australia
8.4.6. Rest of APAC
8.5. Latin America
8.5.1. Brazil
8.5.2. Argentina
8.5.3. Colombia
8.5.4. Rest of LATAM
8.6. Middle East and Africa
8.6.1. Israel
8.6.2. Turkey
8.6.3. Egypt
8.6.4. Rest of MEA
(delivers a detailed regional and country-level analysis, supporting the client in recognizing growth hotspots and strategically allocating resources across geographies)
9. Next-Gen Smart Implants Market: Competitive Landscape & Company Profiles
9.1. Market Share Analysis (2024)
9.2. Company Positioning Matrix (Leaders, Innovators, Emerging Players)
9.3. Company Profiles (Key Players: Overview, Products, Strategies, Financials, Recent Developments)
9.3.1. Medtronic
9.3.2. Johnson & Johnson (DePuy Synthes)
9.3.3. Zimmer Biomet
9.3.4. Abbott Laboratories
9.3.5. Boston Scientific Corporation
9.3.6. Stryker Corporation
9.3.7. Smith & Nephew
9.3.8. Biotronik SE
9.3.9. Straumann Group
9.3.10. Cochlear Ltd.
9.3.11. NuVasive Inc.
9.3.12. LivaNova PLC
9.3.13. Globus Medical Inc.
9.3.14. NeuroPace Inc.
9.3.15. Bioness Inc.
9.3.16. Others
Note: All company profiles will include details under the standard heads mentioned in section 10.3 - Overview, Products, Strategies, Financials, and Recent Developments. We also offer customization of the company profiling section based on your specific requirements.
(provides an assessment of key competitors, market shares, and strategic developments, giving the client essential insights to benchmark against or collaborate with industry leaders)
10. Next-Gen Smart Implants Market: Future Market Outlook (2025–2035)
10.1.1. Scenario Analysis (Optimistic, Realistic, Pessimistic)
10.1.2. Disruptive Technologies Impact
10.1.3. Emerging Business Trends
10.1.4. Business Opportunities for startups and existing players
(presents market forecasts and future outlook scenarios, preparing the client for upcoming trends, innovations, and potential shifts in market structure)
11. Next-Gen Smart Implants Market: Strategic Recommendations
(offers strategic recommendations for various stakeholders, enabling the client to make information business decisions that maximize growth and minimize risks)
12. Next-Gen Smart Implants Market: Disclaimer
(states the report’s disclaimers and legal boundaries, ensuring the client understands the terms of use, limitations, and responsibilities associated with the report)
List of Tables
TABLE 1: List of Data Sources
TABLE 2: Market Drivers; Impact Analysis
TABLE 3: Market Restraints; Impact Analysis
TABLE 4: Next-Gen Smart Implants Market: Type Snapshot (2024)
TABLE 5: Segment Dashboard; Definition and Scope, By Type
TABLE 6: Global Next-Gen Smart Implants Market, By Type 2022–2035 (USD Billion)
TABLE 7: Next-Gen Smart Implants Market: End Use Snapshot (2024)
TABLE 8: Segment Dashboard; Definition and Scope, End Use
TABLE 9: Global Next-Gen Smart Implants Market, End Use 2022–2035 (USD Billion)
TABLE 10: Next-Gen Smart Implants Market: Application Snapshot (2024)
TABLE 11: Segment Dashboard; Definition and Scope, By Application
TABLE 12: Global Next-Gen Smart Implants Market, by Application 2022–2035 (USD Billion)
TABLE 13: Next-Gen Smart Implants Market: Regional Snapshot (2024)
TABLE 14: Segment Dashboard; Definition and Scope, by Region
TABLE 15: Global Next-Gen Smart Implants Market, by Region 2022–2035 (USD Billion)
TABLE 16: Next-Gen Smart Implants Market, by Country (NA), 2022–2035 (USD Billion)
TABLE 17: Next-Gen Smart Implants Market, By Type (NA), 2022–2035 (USD Billion)
TABLE 18: Next-Gen Smart Implants Market, End Use (NA), 2022–2035 (USD Billion)
TABLE 19: Next-Gen Smart Implants Market, by Application (NA), 2024–2035 (USD Billion)
TABLE 20: U.S. Next-Gen Smart Implants Market, By Type, 2022–2035 (USD Billion)
TABLE 21: U.S. Next-Gen Smart Implants Market, End Use, 2022–2035 (USD Billion)
TABLE 22: U.S. Next-Gen Smart Implants Market, by Application, 2022–2035 (USD Billion)
TABLE 23: Canada Next-Gen Smart Implants Market, By Type, 2022–2035 (USD Billion)
TABLE 24: Canada Next-Gen Smart Implants Market, End Use, 2022–2035 (USD Billion)
TABLE 25: Canada Next-Gen Smart Implants Market, by Application, 2022–2035 (USD Billion)
TABLE 26: Mexico Next-Gen Smart Implants Market, By Type, 2022–2035 (USD Billion)
TABLE 27: Mexico Next-Gen Smart Implants Market, End Use, 2022–2035 (USD Billion)
TABLE 28: Mexico Next-Gen Smart Implants Market, by Application, 2022–2035 (USD Billion)
TABLE 29: Next-Gen Smart Implants Market, by Country (Europe), 2022–2035 (USD Billion)
TABLE 30: Next-Gen Smart Implants Market, By Type (Europe), 2022–2035 (USD Billion)
TABLE 31: Next-Gen Smart Implants Market, End Use (Europe), 2022–2035 (USD Billion)
TABLE 32: Next-Gen Smart Implants Market, by Application (Europe), 2022–2035 (USD Billion)
TABLE 33: Germany Next-Gen Smart Implants Market, By Type, 2022–2035 (USD Billion)
TABLE 34: Germany Next-Gen Smart Implants Market, End Use, 2022–2035 (USD Billion)
TABLE 35: Germany Next-Gen Smart Implants Market, by Application, 2022–2035 (USD Billion)
TABLE 36: Italy Next-Gen Smart Implants Market, By Type, 2022–2035 (USD Billion)
TABLE 37: Italy Next-Gen Smart Implants Market, End Use, 2022–2035 (USD Billion)
TABLE 38: Italy Next-Gen Smart Implants Market, by Application, 2022–2035 (USD Billion)
TABLE 39: United Kingdom Next-Gen Smart Implants Market, By Type, 2022–2035 (USD Billion)
TABLE 40: United Kingdom Next-Gen Smart Implants Market, End Use, 2022–2035 (USD Billion)
TABLE 41: United Kingdom Next-Gen Smart Implants Market, by Application, 2022–2035 (USD Billion)
TABLE 42: France Next-Gen Smart Implants Market, By Type, 2022–2035 (USD Billion)
TABLE 43: France Next-Gen Smart Implants Market, End Use, 2022–2035 (USD Billion)
TABLE 44: France Next-Gen Smart Implants Market, by Application, 2022–2035 (USD Billion)
TABLE 45: Russia Next-Gen Smart Implants Market, By Type, 2022–2035 (USD Billion)
TABLE 46: Russia Next-Gen Smart Implants Market, End Use, 2022–2035 (USD Billion)
TABLE 47: Russia Next-Gen Smart Implants Market, by Application, 2022–2035 (USD Billion)
TABLE 48: Poland Next-Gen Smart Implants Market, By Type, 2022–2035 (USD Billion)
TABLE 49: Poland Next-Gen Smart Implants Market, End Use, 2022–2035 (USD Billion)
TABLE 50: Poland Next-Gen Smart Implants Market, by Application, 2022–2035 (USD Billion)
TABLE 51: Rest of Europe Next-Gen Smart Implants Market, By Type, 2022–2035 (USD Billion)
TABLE 52: Rest of Europe Next-Gen Smart Implants Market, End Use, 2022–2035 (USD Billion)
TABLE 53: Rest of Europe Next-Gen Smart Implants Market, by Application, 2022–2035 (USD Billion)
TABLE 54: Next-Gen Smart Implants Market, by Country (APAC), 2022–2035 (USD Billion)
TABLE 55: Next-Gen Smart Implants Market, By Type (APAC), 2022–2035 (USD Billion)
TABLE 56: Next-Gen Smart Implants Market, End Use (APAC), 2022–2035 (USD Billion)
TABLE 57: Next-Gen Smart Implants Market, by Application (APAC), 2022–2035 (USD Billion)
TABLE 58: India Next-Gen Smart Implants Market, By Type, 2022–2035 (USD Billion)
TABLE 59: India Next-Gen Smart Implants Market, End Use, 2022–2035 (USD Billion)
TABLE 60: India Next-Gen Smart Implants Market, by Application, 2022–2035 (USD Billion)
TABLE 61: China Next-Gen Smart Implants Market, By Type, 2022–2035 (USD Billion)
TABLE 62: China Next-Gen Smart Implants Market, End Use, 2022–2035 (USD Billion)
TABLE 63: China Next-Gen Smart Implants Market, by Application, 2022–2035 (USD Billion)
TABLE 64: Japan Next-Gen Smart Implants Market, By Type, 2022–2035 (USD Billion)
TABLE 65: Japan Next-Gen Smart Implants Market, End Use, 2022–2035 (USD Billion)
TABLE 66: Japan Next-Gen Smart Implants Market, by Application, 2022–2035 (USD Billion)
TABLE 67: South Korea Next-Gen Smart Implants Market, By Type, 2022–2035 (USD Billion)
TABLE 68: South Korea Next-Gen Smart Implants Market, End Use, 2022–2035 (USD Billion)
TABLE 69: South Korea Next-Gen Smart Implants Market, by Application, 2022–2035 (USD Billion)
TABLE 70: Australia Next-Gen Smart Implants Market, By Type, 2022–2035 (USD Billion)
TABLE 71: Australia Next-Gen Smart Implants Market, End Use, 2022–2035 (USD Billion)
TABLE 72: Australia Next-Gen Smart Implants Market, by Application, 2022–2035 (USD Billion)
TABLE 73: Rest of APAC Next-Gen Smart Implants Market, By Type, 2022–2035 (USD Billion)
TABLE 74: Rest of APAC Next-Gen Smart Implants Market, End Use, 2022–2035 (USD Billion)
TABLE 75: Rest of APAC Next-Gen Smart Implants Market, by Application, 2022–2035 (USD Billion)
TABLE 76: Brazil Next-Gen Smart Implants Market, By Type, 2022–2035 (USD Billion)
TABLE 77: Brazil Next-Gen Smart Implants Market, End Use, 2022–2035 (USD Billion)
TABLE 78: Brazil Next-Gen Smart Implants Market, by Application, 2022–2035 (USD Billion)
TABLE 79: Argentina Next-Gen Smart Implants Market, By Type, 2022–2035 (USD Billion)
TABLE 80: Argentina Next-Gen Smart Implants Market, End Use, 2022–2035 (USD Billion)
TABLE 81: Argentina Next-Gen Smart Implants Market, by Application, 2022–2035 (USD Billion)
TABLE 82: Colombia Next-Gen Smart Implants Market, By Type, 2022–2035 (USD Billion)
TABLE 83: Colombia Next-Gen Smart Implants Market, End Use, 2022–2035 (USD Billion)
TABLE 84: Colombia Next-Gen Smart Implants Market, by Application, 2022–2035 (USD Billion)
TABLE 85: Rest of LATAM Next-Gen Smart Implants Market, By Type, 2022–2035 (USD Billion)
TABLE 86: Rest of LATAM Next-Gen Smart Implants Market, End Use, 2022–2035 (USD Billion)
TABLE 87: Rest of LATAM Next-Gen Smart Implants Market, by Application, 2022–2035 (USD Billion)
TABLE 88: Israel Next-Gen Smart Implants Market, By Type, 2022–2035 (USD Billion)
TABLE 89: Israel Next-Gen Smart Implants Market, End Use, 2022–2035 (USD Billion)
TABLE 90: Israel Next-Gen Smart Implants Market, by Application, 2022–2035 (USD Billion)
TABLE 91: Turkey Next-Gen Smart Implants Market, By Type, 2022–2035 (USD Billion)
TABLE 92: Turkey Next-Gen Smart Implants Market, End Use, 2022–2035 (USD Billion)
TABLE 93: Turkey Next-Gen Smart Implants Market, by Application, 2022–2035 (USD Billion)
TABLE 94: Egypt Next-Gen Smart Implants Market, By Type, 2022–2035 (USD Billion)
TABLE 95: Egypt Next-Gen Smart Implants Market, End Use, 2022–2035 (USD Billion)
TABLE 96: Egypt Next-Gen Smart Implants Market, by Application, 2022–2035 (USD Billion)
TABLE 97: Rest of MEA Next-Gen Smart Implants Market, By Type, 2022–2035 (USD Billion)
TABLE 98: Rest of MEA Next-Gen Smart Implants Market, End Use, 2022–2035 (USD Billion)
TABLE 99: Rest of MEA Next-Gen Smart Implants Market, by Application, 2022–2035 (USD Billion)
List of Figures
FIGURE 1: Next-Gen Smart Implants Market Segmentation
FIGURE 2: Market Research Methodology
FIGURE 3: Value Chain Analysis
FIGURE 4: PESTLE Analysis
FIGURE 5: Porter’s Five Forces Analysis
FIGURE 6: Market Attractiveness Analysis
FIGURE 7: Market Dynamics
FIGURE 8: Innovation & Patent Landscape (2020–2024)
FIGURE 9: Competitive Landscape; Key Company Market Share Analysis, 2023
FIGURE 10: Type Segment Market Share Analysis, 2023 & 2035
FIGURE 11: Type Segment Market Size Forecast and Trend Analysis, 2024 to 2035 (USD Billion)
FIGURE 12: End-use Segment Market Share Analysis, 2023 & 2035
FIGURE 13: End-use Segment Market Size Forecast and Trend Analysis, 2024 to 2035 (USD Billion)
FIGURE 14: Application Segment Market Share Analysis, 2023 & 2035
FIGURE 15: Application Segment Market Size Forecast and Trend Analysis, 2024 to 2035 (USD Billion)
FIGURE 16: Regional Segment Market Share Analysis, 2023 & 2035
FIGURE 17: Regional Segment Market Size Forecast and Trend Analysis, 2024 to 2035 (USD Billion)
FIGURE 18: North America Next-Gen Smart Implants Market Share and Leading Players, 2024
FIGURE 19: Europe Next-Gen Smart Implants Market Share and Leading Players, 2024
FIGURE 20: Asia Pacific Next-Gen Smart Implants Market Share and Leading Players, 2024
FIGURE 21: Latin America Next-Gen Smart Implants Market Share and Leading Players, 2024
FIGURE 22: Middle East and Africa Next-Gen Smart Implants Market Share and Leading Players, 2024
FIGURE 23: North America Market Share Analysis by Country, 2024
FIGURE 24: U.S. Next-Gen Smart Implants Market Size, Forecast and Trend Analysis, 2024 to 2035 (USD Billion)
FIGURE 25: Canada Next-Gen Smart Implants Market Size, Forecast and Trend Analysis, 2024 to 2035 (USD Billion)
FIGURE 26: Mexico Next-Gen Smart Implants Market Size, Forecast and Trend Analysis, 2024 to 2035 (USD Billion)
FIGURE 27: Europe Next-Gen Smart Implants Market Share Analysis by Country, 2023
FIGURE 28: Germany Next-Gen Smart Implants Market Size, Forecast and Trend Analysis, 2024 to 2035 (USD Billion)
FIGURE 29: Spain Next-Gen Smart Implants Market Size, Forecast and Trend Analysis, 2024 to 2035 (USD Billion)
FIGURE 30: Italy Next-Gen Smart Implants Market Size, Forecast and Trend Analysis, 2024 to 2035 (USD Billion)
FIGURE 31: France Next-Gen Smart Implants Market Size, Forecast and Trend Analysis, 2024 to 2035 (USD Billion)
FIGURE 32: UK Next-Gen Smart Implants Market Size, Forecast and Trend Analysis, 2024 to 2035 (USD Billion)
FIGURE 33: Russia Next-Gen Smart Implants Market Size, Forecast and Trend Analysis, 2024 to 2035 (USD Billion)
FIGURE 34: Poland Next-Gen Smart Implants Market Size, Forecast and Trend Analysis, 2024 to 2035 (USD Billion)
FIGURE 35: Rest of Europe Next-Gen Smart Implants Market Size, Forecast and Trend Analysis, 2024 to 2035 (USD Billion)
FIGURE 36: Asia Pacific Next-Gen Smart Implants Market Share Analysis by Country, 2023
FIGURE 37: India Next-Gen Smart Implants Market Size, Forecast and Trend Analysis, 2024 to 2035 (USD Billion)
FIGURE 38: China Next-Gen Smart Implants Market Size, Forecast and Trend Analysis, 2024 to 2035 (USD Billion)
FIGURE 39: Japan Next-Gen Smart Implants Market Size, Forecast and Trend Analysis, 2024 to 2035 (USD Billion)
FIGURE 40: South Korea Next-Gen Smart Implants Market Size, Forecast and Trend Analysis, 2024 to 2035 (USD Billion)
FIGURE 41: Australia Next-Gen Smart Implants Market Size, Forecast and Trend Analysis, 2024 to 2035 (USD Billion)
FIGURE 42: Rest of APAC Next-Gen Smart Implants Market Size, Forecast and Trend Analysis, 2024 to 2035 (USD Billion)
FIGURE 43: Latin America Next-Gen Smart Implants Market Size, Forecast and Trend Analysis, 2024 to 2035 (USD Billion)
FIGURE 44: Latin America Next-Gen Smart Implants Market Share Analysis by Country, 2023
FIGURE 45: Brazil Next-Gen Smart Implants Market Size, Forecast and Trend Analysis, 2024 to 2035 (USD Billion)
FIGURE 46: Argentina Next-Gen Smart Implants Market Size, Forecast and Trend Analysis, 2024 to 2035 (USD Billion)
FIGURE 47: Colombia Next-Gen Smart Implants Market Size, Forecast and Trend Analysis, 2024 to 2035 (USD Billion)
FIGURE 48: Rest of LATAM Next-Gen Smart Implants Market Size, Forecast and Trend Analysis, 2024 to 2035 (USD Billion)
- "As a product strategy manager at a medical device company in Boston, the Next-Gen Smart Implants Market Research Report was instrumental in guiding our R&D priorities. The report’s comprehensive analysis of smart orthopedic and cardiovascular implants, integration with IoT platforms, and regulatory pathways helped us identify high-potential product lines. By applying these insights, we were able to optimize our development roadmap, secure executive approvals, and align our innovation strategy with market demand, significantly reducing time-to-market risks."
- Emily Carter, Product Strategy Manager, United States
- "In Germany, where regulatory compliance and clinical validation are critical for implant adoption, this report provided actionable clarity. The Next-Gen Smart Implants Market Research Report offered deep insights into European adoption trends, patient monitoring technologies, and competitive positioning. Our strategic planning team leveraged these findings to design pilot studies, guide partnership decisions with healthcare providers, and optimize investment allocations. The credibility of the data and expert analysis made it a trusted resource for high-level decision-making."
- Lukas Weber, Director of Innovation, Germany
- "As a business development lead at a healthcare technology consultancy in Singapore, I relied on the Next-Gen Smart Implants Market Research Report to navigate the APAC market landscape. The country-level analysis of adoption rates, regulatory frameworks, and technological readiness helped us identify key opportunities for client investments. The actionable insights enabled us to guide clients on market entry strategies and device integration approaches that maximize both clinical impact and commercial returns."
- Alicia Tan, Business Development Lead, Singapore
The Next-Gen Smart Implants Market 2025 report has been authored by a team of seasoned healthcare and medical device market research analysts with extensive expertise in smart implant technologies, IoT-enabled devices, and surgical innovation. With over a decade of experience analyzing implantable devices, clinical adoption trends, and regulatory frameworks across global markets, our analysts deliver insights that are both evidence-based and strategically actionable.
Our research methodology combines primary interviews with surgeons, device manufacturers, healthcare administrators, and technology developers, alongside rigorous secondary research and proprietary market modeling. This multi-source approach ensures that the insights presented are accurate, reliable, and directly applicable to real-world strategic, clinical, and business decisions.
This report is designed to support medical device companies, healthcare executives, and investors in navigating the evolving smart implant ecosystem. Whether evaluating product development priorities, planning market entry strategies, or forming strategic partnerships, the findings provide clarity and actionable guidance that reduce risk and optimize decision-making.
By bridging detailed market intelligence with practical business applications, the Next-Gen Smart Implants Market 2025 report equips stakeholders to implement innovative solutions, enhance patient outcomes, and maintain a competitive edge in a rapidly advancing healthcare landscape.
To explore more of our healthcare market research expertise and stay updated on our latest insights, connect with us on LinkedIn.