Market Outlook
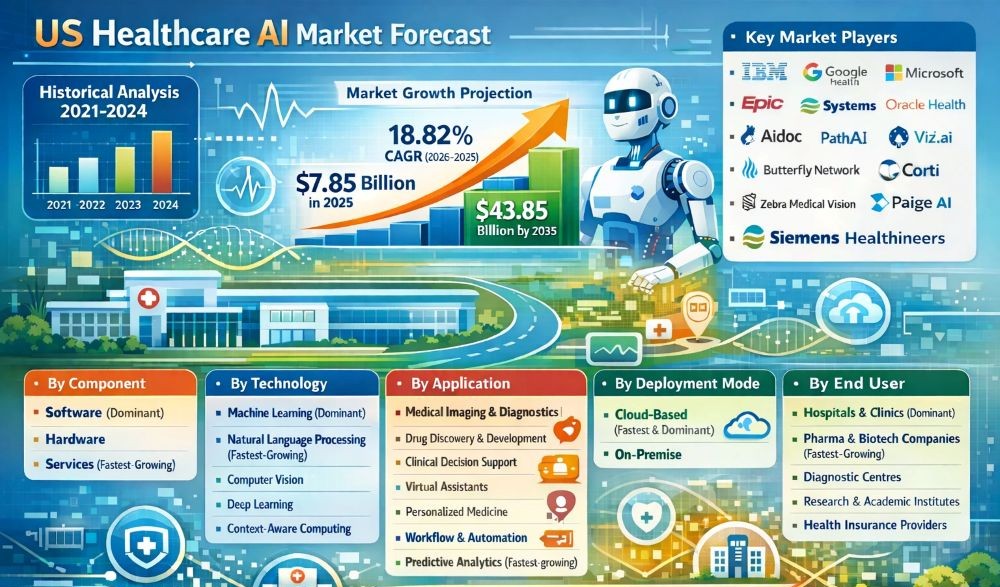
By 2035, the US Healthcare Artificial Intelligence market is expected to reach approximately USD 43.85 billion, growing at a CAGR of 18.82% during the forecast period 2026–2035. The market was valued at USD 7.85 billion in 2025, with historical analysis from 2021 to 2024.
The US healthcare system is slowly turning to AI to help with the growing number of patients, the rising costs, and the complexity of the system. AI tools are no longer just ideas; they are now part of everyday clinical and administrative work. AI is becoming a useful tool for doctors instead of a replacement for them. For example, it helps them read scans faster and cuts down on paperwork. Hospitals, insurance companies, and research centers are all working on solutions that will clearly improve efficiency and patient outcomes. As the amount of data continues to grow, AI is likely to be used more and more in care delivery, diagnostics, and operational planning.
Introduction
According to the US Healthcare Artificial Intelligence Market: Report, this field is shaped by how quickly technology is adopted and how decisions are made based on data. In the U.S., healthcare workers have to deal with issues like not having enough staff, rising treatment costs, and more people getting chronic diseases. Artificial intelligence is being used to make diagnostics smarter, come up with personalized treatment plans, and automate workflows in order to fix these issues. AI technology is now used to process images, predict danger, and get clinical insights in real time. The U.S. is still an important place for the development and use of healthcare AI because it has a lot of digital infrastructure and innovation ecosystems.
Key Market Drivers: What’s Fueling the US Healthcare Artificial Intelligence Market Boom?
- A growing number of people want quick clinical decision-making: Healthcare workers in the U.S. deal with a lot of patient data every day. AI-powered clinical decision support systems help doctors understand test results, imaging, and patient histories better. AI-assisted diagnostic tools can speed up the process of making treatment decisions by cutting the time it takes to read medical images by more than 30%, according to research. This efficiency right away leads to better patient outcomes and less stress at work, making AI a must-have instead of a nice-to-have.
- Reducing administrative costs and automating workflows: About 25% of the money spent on healthcare in the U.S. goes to administrative tasks. AI tools that handle scheduling, billing, and paperwork take care of a lot of manual work. Natural language processing systems now turn doctors' notes into organized records, which saves each clinician hours of work each week. These time and money savings are important US Healthcare Artificial Intelligence Growth Drivers & Challenges that are making hospitals and insurance companies more likely to use it.
Innovation in Focus: How Manufacturers Are Raising the Bar?
New ideas in healthcare AI are getting closer to finding answers that doctors and care teams can trust and use. Newer AI systems are being made to illustrate explicitly how they get to conclusions instead of functioning like a black box. This helps doctors trust and apply the information with confidence. This is very significant when it comes to making judgements about diagnosis and therapy. Real-time data analysis is also helping healthcare workers find possible concerns sooner and act fast when a patient's condition changes. At the same time, cloud-based systems are making it easier to get to and handle data. Better links between health data and wearable technologies are making it possible to keep an eye on patients all the time and give them more personalized care.
Recent Developments
Recent developments in the US Healthcare Artificial Intelligence Market highlight growing real-world adoption across healthcare systems. Hospitals and imaging centers are increasingly using AI-based radiology solutions to reduce diagnostic backlogs and speed up clinical decision-making. Radiology remains the leading AI application, accounting for nearly 80% of FDA-cleared healthcare AI tools, supporting faster detection of conditions such as strokes and cancers. At the same time, major cloud providers are expanding healthcare-focused AI services with strong emphasis on data security and regulatory compliance. These secure, scalable platforms are enabling wider adoption of AI solutions across hospital networks and care providers.
Conclusion
The US Healthcare Artificial Intelligence Market Size & Share continues to expand as providers seek efficiency, accuracy, and cost control. AI adoption is no longer limited to innovation pilots it is becoming embedded across healthcare operations. With strong technology adoption, supportive policy frameworks along with the growing clinical trust, the market is well positioned for long term impact on patient care and system sustainability.
Key Market Players
The US Healthcare Artificial Intelligence Competitive Landscape is moderately consolidated with both specialized entrepreneurs and major healthcare technology companies functioning side by side. While smaller AI businesses focus on innovative solutions and specialist medicinal applications, larger brands in the area offer powerful processing, cloud services and very extensive customer networks. Various organizations proactively establish collaborations with hospitals, cloud service providers & research institutions to evaluate, enhance and expand their solutions within actual environments. Achieving success in this market relies significantly on providing dependable clinical accuracy, adhering to rigorous regulatory standards, and facilitating seamless integration with current healthcare infrastructures. These elements combined continue to influence the long-term investment potential for Artificial Intelligence in the U.S. healthcare sector. Some of the key players in the US Healthcare Artificial Intelligence industry are as:
1. IBM
2. Google Health
3. Microsoft
4. NVIDIA
5. Epic Systems
6. Oracle Health
7. Tempus
8. Aidoc
9. PathAI
10. Viz.ai
11. Butterfly Network
12. Corti
13. Zebra Medical Vision
14. Paige AI
15. Health Catalyst
16. Cerner (Oracle Health)
17. Siemens Healthineers
18. GE HealthCare
19. Philips Healthcare
20. Others
- Software (Dominant): AI software dominates adoption across all 50 US states, led by large healthcare markets such as California, Texas, New York, and Florida. Providers deploy AI software for clinical decision support, medical imaging analytics, population health management, and revenue cycle optimization. State-level Medicaid programs, value-based care models, and multi-state hospital networks drive demand for scalable, cloud-based platforms that comply with varying state regulations while delivering consistent clinical and operational performance.
- Hardware: AI hardware adoption is concentrated in states with strong hospital infrastructure and imaging capacity, including California, Ohio, Minnesota, and Pennsylvania. This segment includes GPUs, AI-enabled scanners, sensors, and edge devices supporting diagnostics, remote monitoring, and robotic procedures. Hardware investment is critical for real-time processing and on-site AI inference, especially in large medical centers and regional diagnostic hubs serving multi-state patient populations.
- Services (Fastest-Growing): AI services are the fastest-growing component across US states as providers seek expertise to implement and manage AI systems effectively. Demand is high in states with complex regulatory and reimbursement environments such as New York, Massachusetts, and Illinois. Services including AI consulting, system integration, model validation, and managed operations help healthcare organizations address workforce gaps, cybersecurity requirements, and state-specific compliance while accelerating AI adoption.
- Machine Learning (Dominant): Machine learning dominates AI adoption across major US states such as California, Texas, New York, and Florida, where large hospital networks and payer systems generate high-volume clinical and claims data. State-level population health programs and value-based care initiatives rely on machine learning for risk prediction, utilization management, and cost optimization. Its ability to adapt to diverse state regulations, payer models, and demographic profiles reinforces nationwide scalability.
- Natural Language Processing (Fastest-Growing): Natural language processing is expanding rapidly across states with high clinician density and complex reporting requirements, including Massachusetts, Illinois, and Pennsylvania. NLP supports automated clinical documentation, coding accuracy, and compliance with state-specific Medicaid and reporting mandates. Growth is also driven by multi-state health systems seeking standardized insights from physician notes, discharge summaries, and patient communications across geographically distributed facilities.
- Computer Vision: Computer vision adoption is strong in states with advanced imaging infrastructure such as California, Ohio, Minnesota, and North Carolina. AI-enabled imaging supports faster diagnostics in radiology, oncology, and cardiology, particularly in large academic medical centers and regional diagnostic hubs. Rural and underserved states are also leveraging computer vision through teleradiology programs to improve diagnostic access and reduce specialist shortages.
- Deep Learning: Deep learning is gaining traction in innovation-driven states like California, Massachusetts, and Washington, supported by strong research ecosystems and AI investment. It is used for complex imaging analysis, genomics, and precision medicine initiatives. Multi-state healthcare organizations adopt deep learning models to standardize advanced diagnostics while accommodating state-level variations in data availability and clinical practice patterns.
- Context-Aware Computing: Context-aware computing is increasingly adopted in states prioritizing digital health and remote care, including Arizona, Colorado, and Texas. It enables personalized monitoring and real-time alerts by adapting to patient behavior, location, and clinical context. Growth is driven by state-specific telehealth expansion, aging populations, and the need to deliver proactive care across urban and rural healthcare settings.
Segmentation By Application
- Medical Imaging & Diagnostics (Dominant): AI adoption in medical imaging is strongest in states with high diagnostic volumes such as California, Texas, New York, and Ohio. Healthcare providers use AI to improve accuracy in radiology, pathology, cardiology, and oncology. State-level teleradiology programs also enable rural states to access specialist-level diagnostics, reducing care gaps and turnaround times.
- Drug Discovery & Development: Drug discovery AI is concentrated in innovation-led states including California, Massachusetts, and New Jersey. Biopharma firms and research institutions leverage AI to accelerate molecule screening, clinical trial design, and regulatory submissions. State-backed life sciences ecosystems and funding initiatives continue to support growth in this segment.
- Clinical Decision Support: Clinical decision support systems are widely deployed across US states to enhance care quality and guideline adherence. States with large hospital networks such as Florida, Illinois, and Pennsylvania use AI-driven insights to support diagnosis, treatment planning, and risk stratification, aligning care delivery with value-based reimbursement models.
- Virtual Assistants: Virtual assistants are gaining traction across states expanding telehealth access, including Arizona, Texas, and Colorado. AI-powered assistants support appointment scheduling, patient triage, medication reminders, and post-discharge follow-ups, improving patient engagement while reducing administrative burden for providers.
- Personalized Medicine: Personalized medicine adoption is led by states with advanced genomics infrastructure such as California, Massachusetts, and Washington. AI enables patient-specific treatment selection by integrating genetic, clinical, and lifestyle data. Multi-state health systems increasingly apply these insights to deliver precision care at scale.
- Workflow & Administrative Automation: AI-driven workflow automation is widely adopted across all US states to address staffing shortages and rising operational costs. Applications include claims processing, billing, coding, and scheduling automation. States with high Medicaid enrollment benefit significantly from reduced administrative inefficiencies and improved financial performance.
- Predictive Analytics (Fastest-growing): Predictive analytics is used nationwide to forecast patient outcomes, resource utilization, and disease trends. States managing large and diverse populations, such as Texas, California, and New York, rely on AI-powered forecasting to support population health programs, reduce readmissions, and improve care coordination.
- Cloud-Based (Fastest & Dominant): Cloud-based deployment dominates across all 50 US states, driven by large healthcare systems in California, Texas, New York, and Florida seeking scalable and cost-efficient AI solutions. Cloud platforms support rapid model updates, multi-state data integration, and compliance with varying state regulations. Adoption is further accelerated by telehealth expansion, remote patient monitoring, and the need to deploy AI capabilities quickly across distributed hospitals and outpatient networks.
- On-Premise: On-premise AI deployment remains relevant in states with strict data governance and large academic medical centers, including Massachusetts, Maryland, and Minnesota. Healthcare organizations choose on-premise systems to maintain direct control over sensitive patient data, support legacy infrastructure, and meet internal security policies. This model is preferred for high-compute imaging workloads and research-driven environments where latency, customization, and data sovereignty are critical.
- Hospitals & Clinics (Dominant): Hospitals and clinics represent the largest end-user segment across all 50 US states, with strong adoption in California, Texas, New York, and Florida. AI is widely used for diagnostics, clinical decision support, workflow automation, and population health management. State-level value-based care programs and hospital consolidation further drive AI deployment to improve care quality, reduce costs, and address workforce shortages.
- Pharmaceutical & Biotech Companies (Fastest-Growing): Pharmaceutical and biotech companies are the fastest-growing AI adopters, led by innovation hubs in California, Massachusetts, and New Jersey. AI supports drug discovery, clinical trial optimization, and real-world evidence generation. State-backed life sciences ecosystems and increased R&D investments accelerate AI integration to shorten development timelines and improve regulatory success rates.
- Diagnostic Centres: Diagnostic centers across states such as Ohio, Pennsylvania, and Illinois increasingly adopt AI to enhance imaging accuracy, reduce turnaround times, and manage high test volumes. AI-powered tools support radiology, pathology, and molecular diagnostics, enabling consistent service delivery across multi-state networks and improving access in underserved regions.
- Research & Academic Institutes: Research and academic institutes play a key role in advancing healthcare AI, particularly in states like Massachusetts, California, and North Carolina. These organizations use AI for genomics, precision medicine, and clinical research. Federal and state research funding supports innovation, collaboration, and early-stage validation of AI-driven healthcare solutions.
- Health Insurance Providers: Health insurance providers across the US leverage AI for claims management, fraud detection, risk assessment, and member engagement. Adoption is strong in states with large insured populations such as Texas, Florida, and New York. AI helps insurers manage rising healthcare costs, support value-based reimbursement models, and improve care coordination across diverse provider networks.
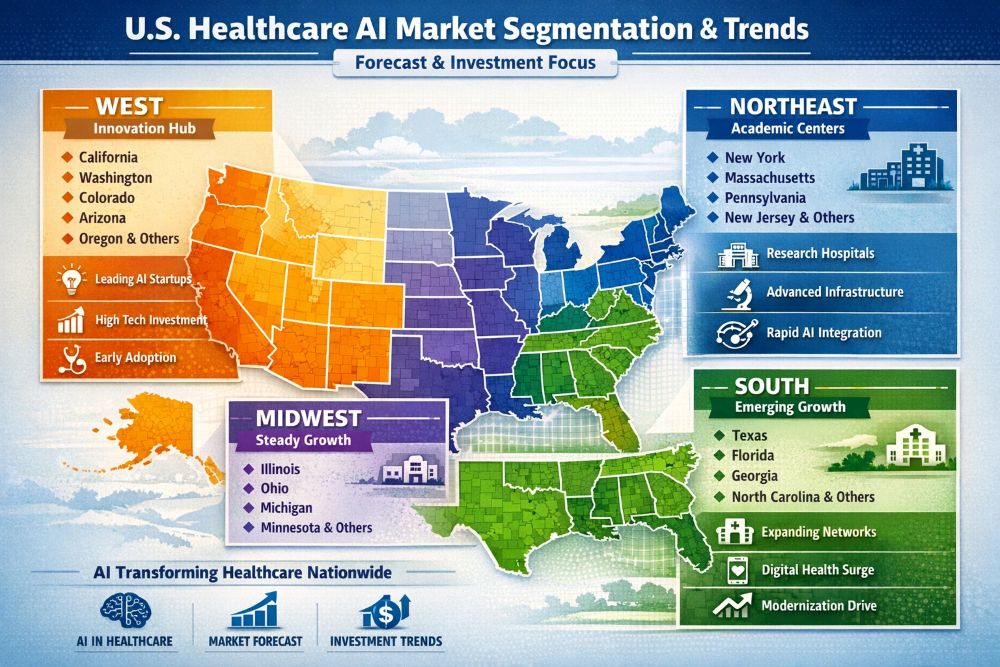
Within the U.S., the West region dominates due to strong AI innovation hubs and technology investment. The Northeast shows fast adoption driven by academic medical centers, while the South is emerging rapidly as healthcare systems modernize. These trends shape the US Healthcare Artificial Intelligence Market: Forecast and investment focus. The following nations and regions will be covered in the report:
- West (Dominant Region)
The West leads the US healthcare AI market due to a strong technology ecosystem and early integration of AI into healthcare delivery. Core states such as California, Washington, Colorado, Arizona, and Oregon drive adoption across imaging, digital health, predictive analytics, and personalized medicine. Surrounding states increasingly adopt similar AI models through regional health systems and cross-state provider networks.
Core states: California, Washington, Colorado, Arizona, Oregon
Other states covered: Nevada, Utah, New Mexico, Idaho, Montana, Wyoming, Alaska, Hawaii - Northeast (Fast Adopting)
The Northeast shows rapid AI adoption supported by advanced healthcare infrastructure and research-driven academic medical centers. Core states including New York, Massachusetts, New Jersey, Pennsylvania, and Connecticut lead AI deployment across clinical care, genomics, and research workflows. Smaller states benefit from proximity to major research hubs and shared healthcare collaborations.
Core states: New York, Massachusetts, New Jersey, Pennsylvania, Connecticut
Other states covered: Maine, Vermont, New Hampshire, Rhode Island, Delaware - South (Fastest-Growing)
The South is emerging as a high-growth region as healthcare systems modernize and expand. Large population states such as Texas, Florida, Georgia, and North Carolina anchor AI adoption, while neighboring states accelerate uptake through expanding hospital networks and digital health programs. AI is increasingly used to improve access, efficiency, and care coordination across diverse populations.
Core states: Texas, Florida, Georgia, North Carolina, Tennessee, South Carolina, Alabama
Other states covered: Mississippi, Louisiana, Arkansas, Kentucky, Oklahoma, Virginia, Maryland, West Virginia - Midwest (Steady Growth)
The Midwest demonstrates steady and practical AI adoption focused on efficiency and patient outcomes. Core states such as Illinois, Ohio, Michigan, Minnesota, Indiana, Wisconsin, and Missouri lead implementation across hospitals and diagnostic networks. Other Midwestern states follow with targeted AI deployments aligned to regional healthcare needs.
Core states: Illinois, Ohio, Michigan, Minnesota, Indiana, Wisconsin, Missouri
Other states covered: Iowa, Kansas, Nebraska, North Dakota, South Dakota
1. US Healthcare Artificial Intelligence Market: Market Introduction & Context
1.1. Market Definition
1.2. Scope of the Study
1.3. Research Methodology
1.3.1. Primary Data Collection
1.3.2. Secondary Data Sourcing
1.3.3. External Industry Collaborations
1.3.4. In-House Research Databases
1.3.5. Analytical Frameworks & Forecasting End-Users
1.3.6. Data Validation and Final Report Publishing
1.4. Key Assumptions
1.5. Market Ecosystem Overview
1.6. Stakeholder Analysis (Manufacturers, Suppliers, Growers, Distributors, Retailers)
(introduces the report’s scope, methodology, and assumptions to help the client clearly understand the study's coverage, data sources, and reliability)
2. US Healthcare Artificial Intelligence Market: Executive Summary
2.1. Key Insights & Market Snapshots
2.2. Analyst Viewpoint
2.3. Market Attractiveness Index
(offers a brief yet insightful market summary, giving the client a quick grasp of key trends, market potential, and strategic highlights)
3. US Healthcare Artificial Intelligence Market: Market Dynamics & Outlook
3.1. Drivers and their impact analysis
3.2. Restraints and their impact analysis
3.3. Opportunities and their impact analysis (Emerging Markets, New Product Categories)
3.4. Patent & Innovation Analysis (2020–2025)
(explains the major drivers, restraints, opportunities, and challenges shaping the market, enabling the client to assess both growth prospects and potential risks)
4. US Healthcare Artificial Intelligence Market: Market Environment & Industry
4.1. PESTEL Analysis
4.1.1. Political
4.1.2. Economic
4.1.3. Social
4.1.4. Technological
4.1.5. Environmental
4.1.6. Legal
4.2. Porter’s Five Forces Analysis
4.2.1. Threat of New Entrants
4.2.2. Bargaining Power of Buyers
4.2.3. Bargaining Power of Suppliers
4.2.4. Substitution Risk
4.2.5. Competitive Rivalry
4.3. Pricing Trend Analysis by Region (2024–2030)
4.4. Value Chain & Supply Chain Analysis
4.5. Impact of Digitalization
4.6. Application & Innovation Landscape
4.7. Regulatory Framework Analysis
4.8. Import/Export Restrictions & Tariff Impact
4.9. Government Initiatives
4.10. Impact of Escalating Geopolitical Tensions
(provides an overview of the industry landscape, covering market dynamics, technological advancements, pricing trends, and regulatory influences for informed decision-making)
5. US Healthcare Artificial Intelligence Market – By Component
5.1. Overview
5.1.1. Segment Share Analysis, By Component, 2025 & 2035(%)
5.1.2. Software
5.1.3. Hardware
5.1.4. Services
(presents market segmentation by Component, guiding the client on the component categories that are expected to drive demand and shape future revenue streams)
6. US Healthcare Artificial Intelligence Market – By Technology
6.1. Overview
6.1.1. Segment Share Analysis, By Technology, 2025 & 2035 (%)
6.1.2. Machine Learning
6.1.3. Natural Language Processing (NLP)
6.1.4. Computer Vision
6.1.5. Deep Learning
6.1.6. Context-Aware Computing
(breaks down the market by technology, assisting the client in identifying technology or origin preferences and emerging growth segments)
7. US Healthcare Artificial Intelligence Market – By Application
7.1. Overview
7.1.1. Segment Share Analysis, By Application, 2025 & 2035(%)
7.1.2. Medical Imaging & Diagnostics
7.1.3. Drug Discovery & Development
7.1.4. Clinical Decision Support
7.1.5. Virtual Assistants
7.1.6. Personalized Medicine
7.1.7. Workflow & Administrative Automation
7.1.8. Predictive Analytics
(focuses on market segmentation by Application, helping the client prioritize areas that offer significant business opportunities)
8. US Healthcare Artificial Intelligence Market – By Deployment Mode
8.1. Overview
8.1.1. Segment Share Analysis, By Deployment mode, 2025 & 2035(%)
8.1.2. On-Premise
8.1.3. Cloud-Based
(breaks down the market by type of deployment, helping stakeholders understand user accessibility preferences and compatibility trends across regions and use-cases)
9. US Healthcare Artificial Intelligence Market – By End-User
9.1. Overview
9.1.1. Segment Share Analysis, By End-User, 2025 & 2035(%)
9.1.2. Hospitals & Clinics
9.1.3. Pharmaceutical & Biotechnology Companies
9.1.4. Diagnostic Centres
9.1.5. Research & Academic Institutes
9.1.6. Health Insurance Providers
(describes the market division by End-User of Application, enabling the client to understand which usage methods are preferred and where future demand may rise)
10. US Healthcare Artificial Intelligence Market– By Geography
10.1. Introduction
10.1.1. Segment Share Analysis, By Geography, 2025 & 2035 (%)
10.2. West Region
10.2.1. Regional Overview & Trends
10.2.2. West Region Healthcare Artificial Intelligence Key Manufacturers in West Region
10.2.3. West Region Market Size and Forecast, By State, 2025 - 2035 (US$ Million)
10.2.4. West Region Market Size and Forecast, By Component, 2025 - 2035 (US$ Million)
10.2.5. West Region Market Size and Forecast, By Technology, 2025 - 2035 (US$ Million)
10.2.6. West Region Market Size and Forecast, By Deployment Mode, 2025 - 2035 (US$ Million)
10.2.7. West Region Market Size and Forecast, By Application, 2025 - 2035 (US$ Million)
10.2.8. West Region Market Size and Forecast, By End-User, 2025 - 2035 (US$ Million)
10.2.9. California
10.2.9.1. Overview
10.2.9.2. California Market Size and Forecast, By Component, 2025 - 2035 (US$ Million)
10.2.9.3. California Market Size and Forecast, By Technology, 2025 - 2035 (US$ Million)
10.2.9.4. California Market Size and Forecast, By Application, 2025 - 2035 (US$ Million)
10.2.9.5. California Market Size and Forecast, By Deployment Mode, 2025 - 2035 (US$ Million)
10.2.9.6. California Market Size and Forecast, By End-User, 2025 - 2035 (US$ Million)
10.2.10. Washington
10.2.10.1. Overview
10.2.10.2. Washington Market Size and Forecast, By Component, 2025 - 2035 (US$ Million)
10.2.10.3. Washington Market Size and Forecast, By Technology, 2025 - 2035 (US$ Million)
10.2.10.4. Washington Market Size and Forecast, By Application, 2025 - 2035 (US$ Million)
10.2.10.5. Washington Market Size and Forecast, By Deployment Mode, 2025 - 2035 (US$ Million)
10.2.10.6. Washington Market Size and Forecast, By End-User, 2025 - 2035 (US$ Million)
10.2.11. Colorado
10.2.11.1. Overview
10.2.11.2. Washington Market Size and Forecast, By Component, 2025 - 2035 (US$ Million)
10.2.11.3. Washington Market Size and Forecast, By Technology, 2025 - 2035 (US$ Million)
10.2.11.4. Washington Market Size and Forecast, By Application, 2025 - 2035 (US$ Million)
10.2.11.5. Washington Market Size and Forecast, By Deployment Mode, 2025 - 2035 (US$ Million)
10.2.11.6. Washington Market Size and Forecast, By End-User, 2025 - 2035 (US$ Million)
10.2.12. Arizona
10.2.12.1. Overview
10.2.12.2. Washington Market Size and Forecast, By Component, 2025 - 2035 (US$ Million)
10.2.12.3. Washington Market Size and Forecast, By Technology, 2025 - 2035 (US$ Million)
10.2.12.4. Washington Market Size and Forecast, By Application, 2025 - 2035 (US$ Million)
10.2.12.5. Washington Market Size and Forecast, By Deployment Mode, 2025 - 2035 (US$ Million)
10.2.12.6. Washington Market Size and Forecast, By End-User, 2025 - 2035 (US$ Million)
10.2.13. Oregon
10.2.13.1. Overview
10.2.13.2. Washington Market Size and Forecast, By Component, 2025 - 2035 (US$ Million)
10.2.13.3. Washington Market Size and Forecast, By Technology, 2025 - 2035 (US$ Million)
10.2.13.4. Washington Market Size and Forecast, By Application, 2025 - 2035 (US$ Million)
10.2.13.5. Washington Market Size and Forecast, By Deployment Mode, 2025 - 2035 (US$ Million)
10.2.13.6. Washington Market Size and Forecast, By End-User, 2025 - 2035 (US$ Million)
10.2.14. Others (Utah, Nevada, New Mexico, Idaho, Montana, Wyoming, Alaska, Hawaii
10.2.14.1. Overview
10.2.14.2. Others Market Size and Forecast, By Component, 2025 - 2035 (US$ Million)
10.2.14.3. Others Market Size and Forecast, By Technology, 2025 - 2035 (US$ Million)
10.2.14.4. Others Market Size and Forecast, By Application, 2025 - 2035 (US$ Million)
10.2.14.5. Others Market Size and Forecast, By Deployment Mode, 2025 - 2035 (US$ Million)
10.2.14.6. Others Market Size and Forecast, By End-User, 2025 - 2035 (US$ Million)
Note: Similar information and analysis will be provided for all other states (Northeast, South, and Midwest) listed in the subsequent sections.
10.3. Northeast
10.3.1. New York
10.3.2. Massachusetts
10.3.3. New Jersey
10.3.4. Pennsylvania
10.3.5. Connecticut
10.3.6. Others (Maine, Vermont, New Hampshire, Rhode Island, Delaware)
10.4. South
10.4.1. Texas
10.4.2. Florida
10.4.3. Georgia
10.4.4. North Carolina
10.4.5. Tennessee
10.4.6. South Carolina
10.4.7. Alabama
10.4.8. Others (Mississippi, Louisiana, Arkansas, Kentucky, Oklahoma, Maryland, Virginia, West Virginia)
10.5. Midwest
10.5.1. Illinois
10.5.2. Ohio
10.5.3. Michigan
10.5.4. Minnesota
10.5.5. Indiana
10.5.6. Wisconsin
10.5.7. Missouri
10.5.8. Others (Iowa, Kansas, Nebraska, North Dakota, South Dakota)
(delivers a detailed state-level analysis, supporting the client in recognizing growth hotspots and strategically allocating resources across geographies)
11. US Healthcare Artificial Intelligence Market: Competitive Landscape & Company Profiles
11.1. Market Share Analysis (2025)
11.2. Company Positioning Matrix (Leaders, Innovators, Emerging Players)
11.3. Company Profiles (Key Players: Overview, Products, Strategies, Financials, Recent Developments)
11.3.1. IBM
11.3.2. Google Health
11.3.3. Microsoft
11.3.4. NVIDIA
11.3.5. Epic Systems
11.3.6. Oracle Health
11.3.7. Tempus
11.3.8. Aidoc
11.3.9. PathAI
11.3.10. Viz.ai
11.3.11. Butterfly Network
11.3.12. Corti
11.3.13. Zebra Medical Vision
11.3.14. Paige AI
11.3.15. Health Catalyst
11.3.16. Cerner (Oracle Health)
11.3.17. Siemens Healthineers
11.3.18. GE HealthCare
11.3.19. Philips Healthcare
11.3.20. Others
Note: All company profiles will include details under the standard heads mentioned in section 10.3 - Overview, Products, Strategies, Financials, and Recent Developments. We also offer customization of the company profiling section based on your specific requirements.
(provides an assessment of key competitors, market shares, and strategic developments, giving the client essential insights to benchmark against or collaborate with industry leaders)
12. US Healthcare Artificial Intelligence Market: Future Market Outlook (2025–2035)
12.1. Scenario Analysis (Optimistic, Realistic, Pessimistic)
12.2. Disruptive Technologies Impact
12.3. Emerging Business Trends
12.4. Business Opportunities for startups and existing players
(presents market forecasts and future outlook scenarios, preparing the client for upcoming trends, innovations, and potential shifts in market structure)
13. US Healthcare Artificial Intelligence Market: Strategic Recommendations
(offers strategic recommendations for various stakeholders, enabling the client to make informed business decisions that maximize growth and minimize risks)
14. US Healthcare Artificial Intelligence Market: Disclaimer
(states the report’s disclaimers and legal boundaries, ensuring the client understands the terms of use, limitations, and responsibilities associated with the report)
List of Tables
TABLE 1: List of Data Sources
TABLE 2: Market Drivers; Impact Analysis
TABLE 3: Market Restraints; Impact Analysis
TABLE 4: US Healthcare Artificial Intelligence Market: Component Snapshot (2025)
TABLE 5: Segment Dashboard; Definition and Scope, by Component
TABLE 6: US Healthcare Artificial Intelligence Market, by Component, 2022–2035 (USD Million)
TABLE 7: US Healthcare Artificial Intelligence Market: Technology Snapshot (2025)
TABLE 8: Segment Dashboard; Definition and Scope, by Technology
TABLE 9: US Healthcare Artificial Intelligence Market, by Technology, 2022–2035 (USD Million)
TABLE 10: US Healthcare Artificial Intelligence Market: Application Snapshot (2025)
TABLE 11: Segment Dashboard; Definition and Scope, by Application
TABLE 12: US Healthcare Artificial Intelligence Market, by Application, 2022–2035 (USD Million)
TABLE 13: US Healthcare Artificial Intelligence Market: Deployment Mode Snapshot (2025)
TABLE 14: Segment Dashboard; Definition and Scope, by Deployment Mode
TABLE 15: US Healthcare Artificial Intelligence Market, by Deployment Mode, 2022–2035 (USD Million)
TABLE 16: US Healthcare Artificial Intelligence Market: End-User Snapshot (2025)
TABLE 17: Segment Dashboard; Definition and Scope, by End-User
TABLE 18: US Healthcare Artificial Intelligence Market, by End-User, 2022–2035 (USD Million)
TABLE 19: US Healthcare Artificial Intelligence Market: Regional Snapshot (2025)
TABLE 20: Segment Dashboard; Definition and Scope, by Region
TABLE 21: US Healthcare Artificial Intelligence Market, by Region, 2022–2035 (USD Million)
TABLE 22: California Healthcare Artificial Intelligence Market, by Component, 2022–2035 (USD Million)
TABLE 23: California Healthcare Artificial Intelligence Market, by Technology, 2022–2035 (USD Million)
TABLE 24: California Healthcare Artificial Intelligence Market, by Deployment Mode, 2022–2035 (USD Million)
TABLE 25: California Healthcare Artificial Intelligence Market, by Application, 2022–2035 (USD Million)
TABLE 26: California Healthcare Artificial Intelligence Market, by End-User, 2022–2035 (USD Million)
TABLE 27: Washington Healthcare Artificial Intelligence Market, by Component, 2022–2035 (USD Million)
TABLE 28: Washington Healthcare Artificial Intelligence Market, by Technology, 2022–2035 (USD Million)
TABLE 29: Washington Healthcare Artificial Intelligence Market, by Deployment Mode, 2022–2035 (USD Million)
TABLE 30: Washington Healthcare Artificial Intelligence Market, by Application, 2022–2035 (USD Million)
TABLE 31: Washington Healthcare Artificial Intelligence Market, by End-User, 2022–2035 (USD Million)
TABLE 32: Colorado Healthcare Artificial Intelligence Market, by Component, 2022–2035 (USD Million)
TABLE 33: Colorado Healthcare Artificial Intelligence Market, by Technology, 2022–2035 (USD Million)
TABLE 34: Colorado Healthcare Artificial Intelligence Market, by Deployment Mode, 2022–2035 (USD Million)
TABLE 35: Colorado Healthcare Artificial Intelligence Market, by Application, 2022–2035 (USD Million)
TABLE 36: Colorado Healthcare Artificial Intelligence Market, by End-User, 2022–2035 (USD Million)
TABLE 37: Arizona Healthcare Artificial Intelligence Market, by Component, 2022–2035 (USD Million)
TABLE 38: Arizona Healthcare Artificial Intelligence Market, by Technology, 2022–2035 (USD Million)
TABLE 39: Arizona Healthcare Artificial Intelligence Market, by Deployment Mode, 2022–2035 (USD Million)
TABLE 40: Arizona Healthcare Artificial Intelligence Market, by Application, 2022–2035 (USD Million)
TABLE 41: Arizona Healthcare Artificial Intelligence Market, by End-User, 2022–2035 (USD Million)
TABLE 42: Oregon Healthcare Artificial Intelligence Market, by Component, 2022–2035 (USD Million)
TABLE 43: Oregon Healthcare Artificial Intelligence Market, by Technology, 2022–2035 (USD Million)
TABLE 44: Oregon Healthcare Artificial Intelligence Market, by Deployment Mode, 2022–2035 (USD Million)
TABLE 45: Oregon Healthcare Artificial Intelligence Market, by Application, 2022–2035 (USD Million)
TABLE 46: Oregon Healthcare Artificial Intelligence Market, by End-User, 2022–2035 (USD Million)
TABLE 47: West – Others Healthcare Artificial Intelligence Market, by Component, 2022–2035 (USD Million)
TABLE 48: West – Others Healthcare Artificial Intelligence Market, by Technology, 2022–2035 (USD Million)
TABLE 49: West – Others Healthcare Artificial Intelligence Market, by Deployment Mode, 2022–2035 (USD Million)
TABLE 50: West – Others Healthcare Artificial Intelligence Market, by Application, 2022–2035 (USD Million)
TABLE 51: West – Others Healthcare Artificial Intelligence Market, by End-User, 2022–2035 (USD Million)
(Nevada, Utah, New Mexico, Idaho, Montana, Wyoming, Alaska, Hawaii)
TABLE 52: New York Healthcare Artificial Intelligence Market, by Component, 2022–2035 (USD Million)
TABLE 53: New York Healthcare Artificial Intelligence Market, by Technology, 2022–2035 (USD Million)
TABLE 54: New York Healthcare Artificial Intelligence Market, by Deployment Mode, 2022–2035 (USD Million)
TABLE 55: New York Healthcare Artificial Intelligence Market, by Application, 2022–2035 (USD Million)
TABLE 56: New York Healthcare Artificial Intelligence Market, by End-User, 2022–2035 (USD Million)
TABLE 57: Massachusetts Healthcare Artificial Intelligence Market, by Component, 2022–2035 (USD Million)
TABLE 58: Massachusetts Healthcare Artificial Intelligence Market, by Technology, 2022–2035 (USD Million)
TABLE 59: Massachusetts Healthcare Artificial Intelligence Market, by Deployment Mode, 2022–2035 (USD Million)
TABLE 60: Massachusetts Healthcare Artificial Intelligence Market, by Application, 2022–2035 (USD Million)
TABLE 61: Massachusetts Healthcare Artificial Intelligence Market, by End-User, 2022–2035 (USD Million)
TABLE 62: New Jersey Healthcare Artificial Intelligence Market, by Component, 2022–2035 (USD Million)
TABLE 63: New Jersey Healthcare Artificial Intelligence Market, by Technology, 2022–2035 (USD Million)
TABLE 64: New Jersey Healthcare Artificial Intelligence Market, by Deployment Mode, 2022–2035 (USD Million)
TABLE 65: New Jersey Healthcare Artificial Intelligence Market, by Application, 2022–2035 (USD Million)
TABLE 66: New Jersey Healthcare Artificial Intelligence Market, by End-User, 2022–2035 (USD Million)
TABLE 67: Pennsylvania Healthcare Artificial Intelligence Market, by Component, 2022–2035 (USD Million)
TABLE 68: Pennsylvania Healthcare Artificial Intelligence Market, by Technology, 2022–2035 (USD Million)
TABLE 69: Pennsylvania Healthcare Artificial Intelligence Market, by Deployment Mode, 2022–2035 (USD Million)
TABLE 70: Pennsylvania Healthcare Artificial Intelligence Market, by Application, 2022–2035 (USD Million)
TABLE 71: Pennsylvania Healthcare Artificial Intelligence Market, by End-User, 2022–2035 (USD Million)
TABLE 72: Connecticut Healthcare Artificial Intelligence Market, by Component, 2022–2035 (USD Million)
TABLE 73: Connecticut Healthcare Artificial Intelligence Market, by Technology, 2022–2035 (USD Million)
TABLE 74: Connecticut Healthcare Artificial Intelligence Market, by Deployment Mode, 2022–2035 (USD Million)
TABLE 75: Connecticut Healthcare Artificial Intelligence Market, by Application, 2022–2035 (USD Million)
TABLE 76: Connecticut Healthcare Artificial Intelligence Market, by End-User, 2022–2035 (USD Million)
TABLE 77: Northeast – Others Healthcare Artificial Intelligence Market, by Component, 2022–2035 (USD Million)
TABLE 78: Northeast – Others Healthcare Artificial Intelligence Market, by Technology, 2022–2035 (USD Million)
TABLE 79: Northeast – Others Healthcare Artificial Intelligence Market, by Deployment Mode, 2022–2035 (USD Million)
TABLE 80: Northeast – Others Healthcare Artificial Intelligence Market, by Application, 2022–2035 (USD Million)
TABLE 81: Northeast – Others Healthcare Artificial Intelligence Market, by End-User, 2022–2035 (USD Million)
(Maine, Vermont, New Hampshire, Rhode Island, Delaware)
TABLE 82: Texas Healthcare Artificial Intelligence Market, by Component, 2022–2035 (USD Million)
TABLE 83: Texas Healthcare Artificial Intelligence Market, by Technology, 2022–2035 (USD Million)
TABLE 84: Texas Healthcare Artificial Intelligence Market, by Deployment Mode, 2022–2035 (USD Million)
TABLE 85: Texas Healthcare Artificial Intelligence Market, by Application, 2022–2035 (USD Million)
TABLE 86: Texas Healthcare Artificial Intelligence Market, by End-User, 2022–2035 (USD Million)
TABLE 87: Florida Healthcare Artificial Intelligence Market, by Component, 2022–2035 (USD Million)
TABLE 88: Florida Healthcare Artificial Intelligence Market, by Technology, 2022–2035 (USD Million)
TABLE 89: Florida Healthcare Artificial Intelligence Market, by Deployment Mode, 2022–2035 (USD Million)
TABLE 90: Florida Healthcare Artificial Intelligence Market, by Application, 2022–2035 (USD Million)
TABLE 91: Florida Healthcare Artificial Intelligence Market, by End-User, 2022–2035 (USD Million)
TABLE 92: Georgia Healthcare Artificial Intelligence Market, by Component, 2022–2035 (USD Million)
TABLE 93: Georgia Healthcare Artificial Intelligence Market, by Technology, 2022–2035 (USD Million)
TABLE 94: Georgia Healthcare Artificial Intelligence Market, by Deployment Mode, 2022–2035 (USD Million)
TABLE 95: Georgia Healthcare Artificial Intelligence Market, by Application, 2022–2035 (USD Million)
TABLE 96: Georgia Healthcare Artificial Intelligence Market, by End-User, 2022–2035 (USD Million)
TABLE 97: North Carolina Healthcare Artificial Intelligence Market, by Component, 2022–2035 (USD Million)
TABLE 98: North Carolina Healthcare Artificial Intelligence Market, by Technology, 2022–2035 (USD Million)
TABLE 99: North Carolina Healthcare Artificial Intelligence Market, by Deployment Mode, 2022–2035 (USD Million)
TABLE 100: North Carolina Healthcare Artificial Intelligence Market, by Application, 2022–2035 (USD Million)
TABLE 101: North Carolina Healthcare Artificial Intelligence Market, by End-User, 2022–2035 (USD Million)
TABLE 102: Tennessee Healthcare Artificial Intelligence Market, by Component, 2022–2035 (USD Million)
TABLE 103: Tennessee Healthcare Artificial Intelligence Market, by Technology, 2022–2035 (USD Million)
TABLE 104: Tennessee Healthcare Artificial Intelligence Market, by Deployment Mode, 2022–2035 (USD Million)
TABLE 105: Tennessee Healthcare Artificial Intelligence Market, by Application, 2022–2035 (USD Million)
TABLE 106: Tennessee Healthcare Artificial Intelligence Market, by End-User, 2022–2035 (USD Million)
TABLE 107: South Carolina Healthcare Artificial Intelligence Market, by Component, 2022–2035 (USD Million)
TABLE 108: South Carolina Healthcare Artificial Intelligence Market, by Technology, 2022–2035 (USD Million)
TABLE 109: South Carolina Healthcare Artificial Intelligence Market, by Deployment Mode, 2022–2035 (USD Million)
TABLE 110: South Carolina Healthcare Artificial Intelligence Market, by Application, 2022–2035 (USD Million)
TABLE 111: South Carolina Healthcare Artificial Intelligence Market, by End-User, 2022–2035 (USD Million)
TABLE 112: Alabama Healthcare Artificial Intelligence Market, by Component, 2022–2035 (USD Million)
TABLE 113: Alabama Healthcare Artificial Intelligence Market, by Technology, 2022–2035 (USD Million)
TABLE 114: Alabama Healthcare Artificial Intelligence Market, by Deployment Mode, 2022–2035 (USD Million)
TABLE 115: Alabama Healthcare Artificial Intelligence Market, by Application, 2022–2035 (USD Million)
TABLE 116: Alabama Healthcare Artificial Intelligence Market, by End-User, 2022–2035 (USD Million)
TABLE 117: South – Others Healthcare Artificial Intelligence Market, by Component, 2022–2035 (USD Million)
TABLE 118: South – Others Healthcare Artificial Intelligence Market, by Technology, 2022–2035 (USD Million)
TABLE 119: South – Others Healthcare Artificial Intelligence Market, by Deployment Mode, 2022–2035 (USD Million)
TABLE 120: South – Others Healthcare Artificial Intelligence Market, by Application, 2022–2035 (USD Million)
TABLE 121: South – Others Healthcare Artificial Intelligence Market, by End-User, 2022–2035 (USD Million)
(Mississippi, Louisiana, Arkansas, Kentucky, Oklahoma, Virginia, Maryland, West Virginia)
TABLE 122: Illinois Healthcare Artificial Intelligence Market, by Component, 2022–2035 (USD Million)
TABLE 123: Illinois Healthcare Artificial Intelligence Market, by Technology, 2022–2035 (USD Million)
TABLE 124: Illinois Healthcare Artificial Intelligence Market, by Deployment Mode, 2022–2035 (USD Million)
TABLE 125: Illinois Healthcare Artificial Intelligence Market, by Application, 2022–2035 (USD Million)
TABLE 126: Illinois Healthcare Artificial Intelligence Market, by End-User, 2022–2035 (USD Million)
TABLE 127: Ohio Healthcare Artificial Intelligence Market, by Component, 2022–2035 (USD Million)
TABLE 128: Ohio Healthcare Artificial Intelligence Market, by Technology, 2022–2035 (USD Million)
TABLE 129: Ohio Healthcare Artificial Intelligence Market, by Deployment Mode, 2022–2035 (USD Million)
TABLE 130: Ohio Healthcare Artificial Intelligence Market, by Application, 2022–2035 (USD Million)
TABLE 131: Ohio Healthcare Artificial Intelligence Market, by End-User, 2022–2035 (USD Million)
TABLE 132: Michigan Healthcare Artificial Intelligence Market, by Component, 2022–2035 (USD Million)
TABLE 133: Michigan Healthcare Artificial Intelligence Market, by Technology, 2022–2035 (USD Million)
TABLE 134: Michigan Healthcare Artificial Intelligence Market, by Deployment Mode, 2022–2035 (USD Million)
TABLE 135: Michigan Healthcare Artificial Intelligence Market, by Application, 2022–2035 (USD Million)
TABLE 136: Michigan Healthcare Artificial Intelligence Market, by End-User, 2022–2035 (USD Million)
TABLE 137: Minnesota Healthcare Artificial Intelligence Market, by Component, 2022–2035 (USD Million)
TABLE 138: Minnesota Healthcare Artificial Intelligence Market, by Technology, 2022–2035 (USD Million)
TABLE 139: Minnesota Healthcare Artificial Intelligence Market, by Deployment Mode, 2022–2035 (USD Million)
TABLE 140: Minnesota Healthcare Artificial Intelligence Market, by Application, 2022–2035 (USD Million)
TABLE 141: Minnesota Healthcare Artificial Intelligence Market, by End-User, 2022–2035 (USD Million)
TABLE 142: Indiana Healthcare Artificial Intelligence Market, by Component, 2022–2035 (USD Million)
TABLE 143: Indiana Healthcare Artificial Intelligence Market, by Technology, 2022–2035 (USD Million)
TABLE 144: Indiana Healthcare Artificial Intelligence Market, by Deployment Mode, 2022–2035 (USD Million)
TABLE 145: Indiana Healthcare Artificial Intelligence Market, by Application, 2022–2035 (USD Million)
TABLE 146: Indiana Healthcare Artificial Intelligence Market, by End-User, 2022–2035 (USD Million)
TABLE 147: Wisconsin Healthcare Artificial Intelligence Market, by Component, 2022–2035 (USD Million)
TABLE 148: Wisconsin Healthcare Artificial Intelligence Market, by Technology, 2022–2035 (USD Million)
TABLE 149: Wisconsin Healthcare Artificial Intelligence Market, by Deployment Mode, 2022–2035 (USD Million)
TABLE 150: Wisconsin Healthcare Artificial Intelligence Market, by Application, 2022–2035 (USD Million)
TABLE 151: Wisconsin Healthcare Artificial Intelligence Market, by End-User, 2022–2035 (USD Million)
TABLE 152: Missouri Healthcare Artificial Intelligence Market, by Component, 2022–2035 (USD Million)
TABLE 153: Missouri Healthcare Artificial Intelligence Market, by Technology, 2022–2035 (USD Million)
TABLE 154: Missouri Healthcare Artificial Intelligence Market, by Deployment Mode, 2022–2035 (USD Million)
TABLE 155: Missouri Healthcare Artificial Intelligence Market, by Application, 2022–2035 (USD Million)
TABLE 156: Missouri Healthcare Artificial Intelligence Market, by End-User, 2022–2035 (USD Million)
TABLE 157: Midwest – Others Healthcare Artificial Intelligence Market, by Component, 2022–2035 (USD Million)
TABLE 158: Midwest – Others Healthcare Artificial Intelligence Market, by Technology, 2022–2035 (USD Million)
TABLE 159: Midwest – Others Healthcare Artificial Intelligence Market, by Deployment Mode, 2022–2035 (USD Million)
TABLE 160: Midwest – Others Healthcare Artificial Intelligence Market, by Application, 2022–2035 (USD Million)
TABLE 161: Midwest – Others Healthcare Artificial Intelligence Market, by End-User, 2022–2035 (USD Million)
(Iowa, Kansas, Nebraska, North Dakota, South Dakota)
List of Figures
FIGURE 1: US Healthcare Artificial Intelligence Market Segmentation
FIGURE 2: Market Research Methodology
FIGURE 3: Value Chain Analysis
FIGURE 4: PESTLE Analysis
FIGURE 5: Porter’s Five Forces Analysis
FIGURE 6: Market Attractiveness Analysis
FIGURE 7: Market Dynamics
FIGURE 8: Innovation & Patent Landscape (2020–2024)
FIGURE 9: Competitive Landscape; Key Company Market Share Analysis, 2023
FIGURE 10: Component Segment Market Share Analysis, 2025 & 2035
FIGURE 11: Component Segment Market Size Forecast and Trend Analysis, 2025–2035 (USD Million)
FIGURE 12: Technology Segment Market Share Analysis, 2025 & 2035
FIGURE 13: Technology Segment Market Size Forecast and Trend Analysis, 2025–2035 (USD Million)
FIGURE 14: Application Segment Market Share Analysis, 2025 & 2035
FIGURE 15: Application Segment Market Size Forecast and Trend Analysis, 2025–2035 (USD Million)
FIGURE 16: Deployment Segment Market Share Analysis, 2025 & 2035
FIGURE 17: Deployment Segment Market Size Forecast and Trend Analysis, 2025–2035 (USD Million)
FIGURE 18: End-User Segment Market Share Analysis, 2025 & 2035
FIGURE 19: End-User Segment Market Size Forecast and Trend Analysis, 2025–2035 (USD Million)
FIGURE 20: Regional Segment Market Share Analysis, 2025 & 2035
FIGURE 21: Regional Segment Market Size Forecast and Trend Analysis, 2025–2035 (USD Million)
FIGURE 22: West Region US Healthcare Artificial Intelligence Market Share and Leading Players, 2024
FIGURE 23: Northeast Region US Healthcare Artificial Intelligence Market Share and Leading Players, 2024
FIGURE 24: South Region US Healthcare Artificial Intelligence Market Share and Leading Players, 2024
FIGURE 25: Midwest Region US Healthcare Artificial Intelligence Market Share and Leading Players, 2024
FIGURE 26: West Region Market Share Analysis by State, 2024
FIGURE 27: California Healthcare Artificial Intelligence Market Size, Forecast and Trend Analysis, 2025–2035 (USD Million)
FIGURE 28: Washington Healthcare Artificial Intelligence Market Size, Forecast and Trend Analysis, 2025–2035 (USD Million)
FIGURE 29: Colorado Healthcare Artificial Intelligence Market Size, Forecast and Trend Analysis, 2025–2035 (USD Million)
FIGURE 30: Arizona Healthcare Artificial Intelligence Market Size, Forecast and Trend Analysis, 2025–2035 (USD Million)
FIGURE 31: Oregon Healthcare Artificial Intelligence Market Size, Forecast and Trend Analysis, 2025–2035 (USD Million)
FIGURE 32: Others (West Region) Healthcare Artificial Intelligence Market Size, Forecast and Trend Analysis, 2025–2035 (USD Million)
FIGURE 33: South Region Market Share Analysis by State, 2023
FIGURE 34: Texas Healthcare Artificial Intelligence Market Size, Forecast and Trend Analysis, 2025–2035 (USD Million)
FIGURE 35: Florida Healthcare Artificial Intelligence Market Size, Forecast and Trend Analysis, 2025–2035 (USD Million)
FIGURE 36: Georgia Healthcare Artificial Intelligence Market Size, Forecast and Trend Analysis, 2025–2035 (USD Million)
FIGURE 37: North Carolina Healthcare Artificial Intelligence Market Size, Forecast and Trend Analysis, 2025–2035 (USD Million)
FIGURE 38: Tennessee Healthcare Artificial Intelligence Market Size, Forecast and Trend Analysis, 2025–2035 (USD Million)
FIGURE 39: South Carolina Healthcare Artificial Intelligence Market Size, Forecast and Trend Analysis, 2025–2035 (USD Million)
FIGURE 40: Alabama Healthcare Artificial Intelligence Market Size, Forecast and Trend Analysis, 2025–2035 (USD Million)
FIGURE 41: Others (South Region) Healthcare Artificial Intelligence Market Size, Forecast and Trend Analysis, 2025–2035 (USD Million)
FIGURE 42: Midwest Region Market Share Analysis by State, 2023
FIGURE 43: Illinois Healthcare Artificial Intelligence Market Size, Forecast and Trend Analysis, 2025–2035 (USD Million)
FIGURE 44: Ohio Healthcare Artificial Intelligence Market Size, Forecast and Trend Analysis, 2025–2035 (USD Million)
FIGURE 45: Michigan Healthcare Artificial Intelligence Market Size, Forecast and Trend Analysis, 2025–2035 (USD Million)
FIGURE 46: Minnesota Healthcare Artificial Intelligence Market Size, Forecast and Trend Analysis, 2025–2035 (USD Million)
FIGURE 47: Indiana Healthcare Artificial Intelligence Market Size, Forecast and Trend Analysis, 2025–2035 (USD Million)
FIGURE 48: Wisconsin Healthcare Artificial Intelligence Market Size, Forecast and Trend Analysis, 2025–2035 (USD Million)
FIGURE 49: Missouri Healthcare Artificial Intelligence Market Size, Forecast and Trend Analysis, 2025–2035 (USD Million)
FIGURE 50: Others (Midwest Region) Healthcare Artificial Intelligence Market Size, Forecast and Trend Analysis, 2025–2035 (USD Million)
FIGURE 51: Northeast Region Market Share Analysis by State, 2023
FIGURE 52: New York Healthcare Artificial Intelligence Market Size, Forecast and Trend Analysis, 2025–2035 (USD Million)
FIGURE 53: Massachusetts Healthcare Artificial Intelligence Market Size, Forecast and Trend Analysis, 2025–2035 (USD Million)
FIGURE 54: New Jersey Healthcare Artificial Intelligence Market Size, Forecast and Trend Analysis, 2025–2035 (USD Million)
FIGURE 55: Pennsylvania Healthcare Artificial Intelligence Market Size, Forecast and Trend Analysis, 2025–2035 (USD Million)
FIGURE 56: Connecticut Healthcare Artificial Intelligence Market Size, Forecast and Trend Analysis, 2025–2035 (USD Million)
FIGURE 57: Others (Northeast Region) Healthcare Artificial Intelligence Market Size, Forecast and Trend Analysis, 2025–2035 (USD Million)
- “The state-level depth and US-only focus helped our leadership team confidently prioritize AI investments across clinical and operational use cases. This report directly influenced our multi-year digital health roadmap.”
— Michael Thompson, VP, Strategy & Innovation
- “We used this report to validate market sizing, refine product positioning, and align our US go-to-market strategy. The insights are practical, credible, and built for real business decisions.”
— Jennifer Collins, Director of Market Strategy
This US Healthcare Artificial Intelligence Market Research Report is authored by a specialized healthcare market research team with 10+ years of experience analyzing the US healthcare industry, including provider systems, payers, life sciences companies, and healthcare technology vendors. The authors have deep domain expertise in artificial intelligence in healthcare, clinical decision support systems, medical imaging AI, revenue cycle automation, and population health analytics.
The research team has supported real-world business decisions for US-based organizations, including market entry strategy, product commercialization, investment prioritization, competitive benchmarking, and M&A due diligence. Every insight in this report is grounded in a practical understanding of US healthcare regulations (HIPAA, CMS), reimbursement dynamics, and state-level adoption trends, ensuring accuracy and relevance for executive decision-makers.
This report is designed for C-level executives, strategy leaders, product managers, and investors seeking reliable data on market size, growth forecasts, adoption drivers, and competitive dynamics within the US healthcare AI market. The analysis combines primary interviews, secondary research, historical trend analysis, and forward-looking forecasting models to deliver actionable intelligence that supports budgeting, go-to-market planning, and long-term growth strategy.
The authors follow a transparent, repeatable research methodology and continuously track regulatory updates, technology advancements, and buyer behavior across all 50 US states, reinforcing the credibility and authority of this research.
For ongoing insights, methodology updates, and US healthcare technology research, connect with us on our company LinkedIn page.