Market Outlook
The global Water Treatment Chemicals Market size was valued at USD 37230 million in 2022 and is forecast to a readjusted size of USD 47620 million by 2029 with a CAGR of 3.6% during review period.
Introduction: Why the Water Treatment Chemicals Market Matters in 2025
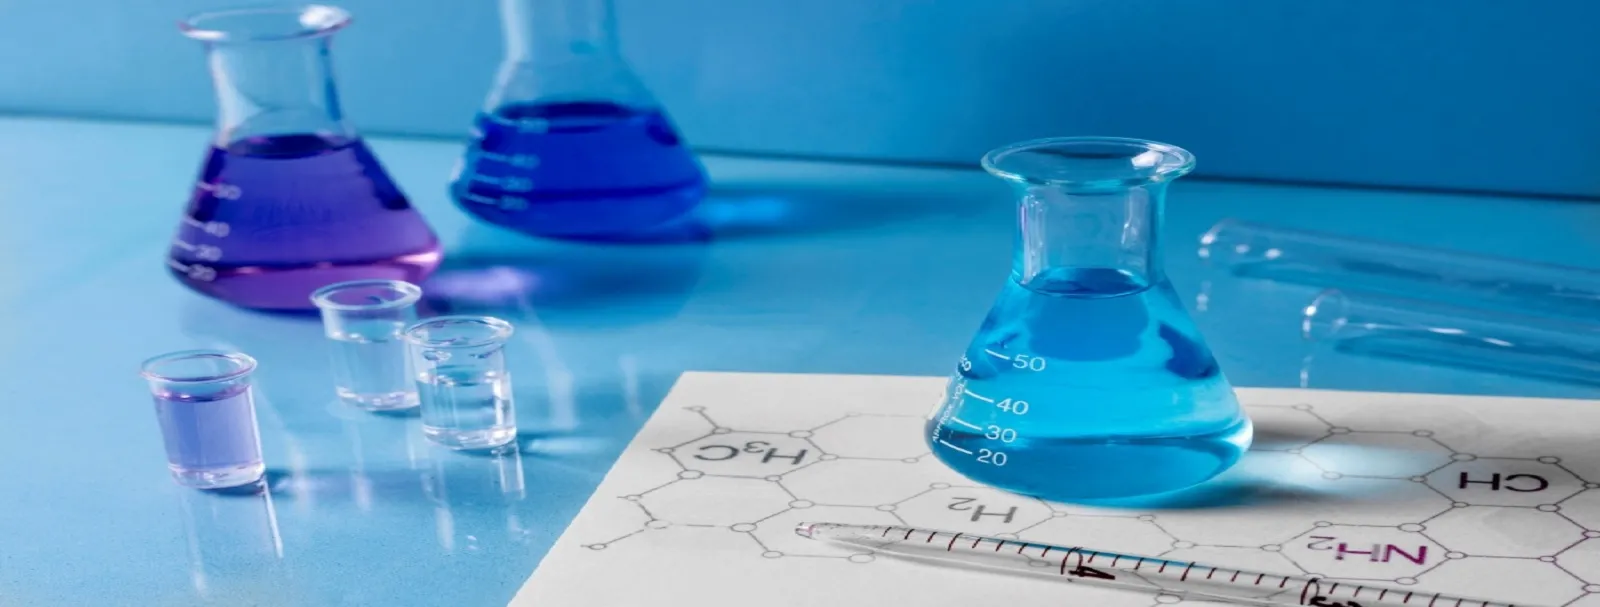
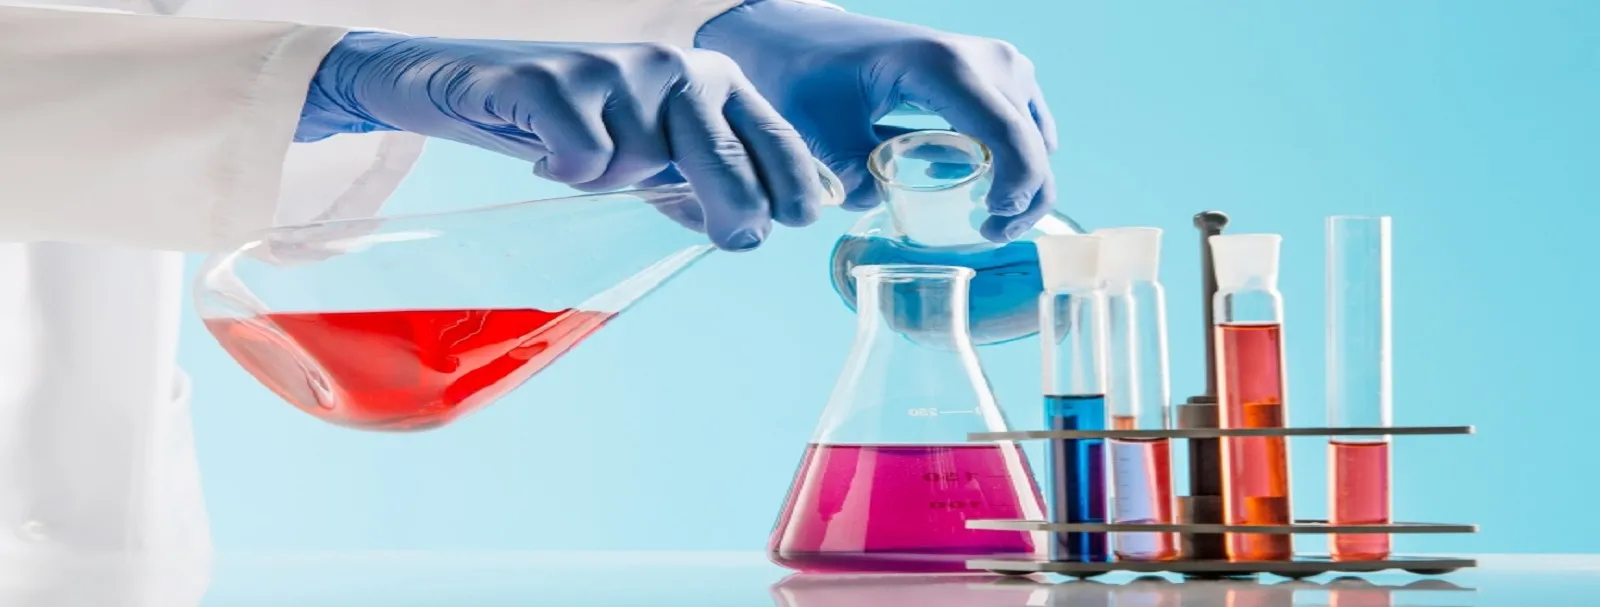
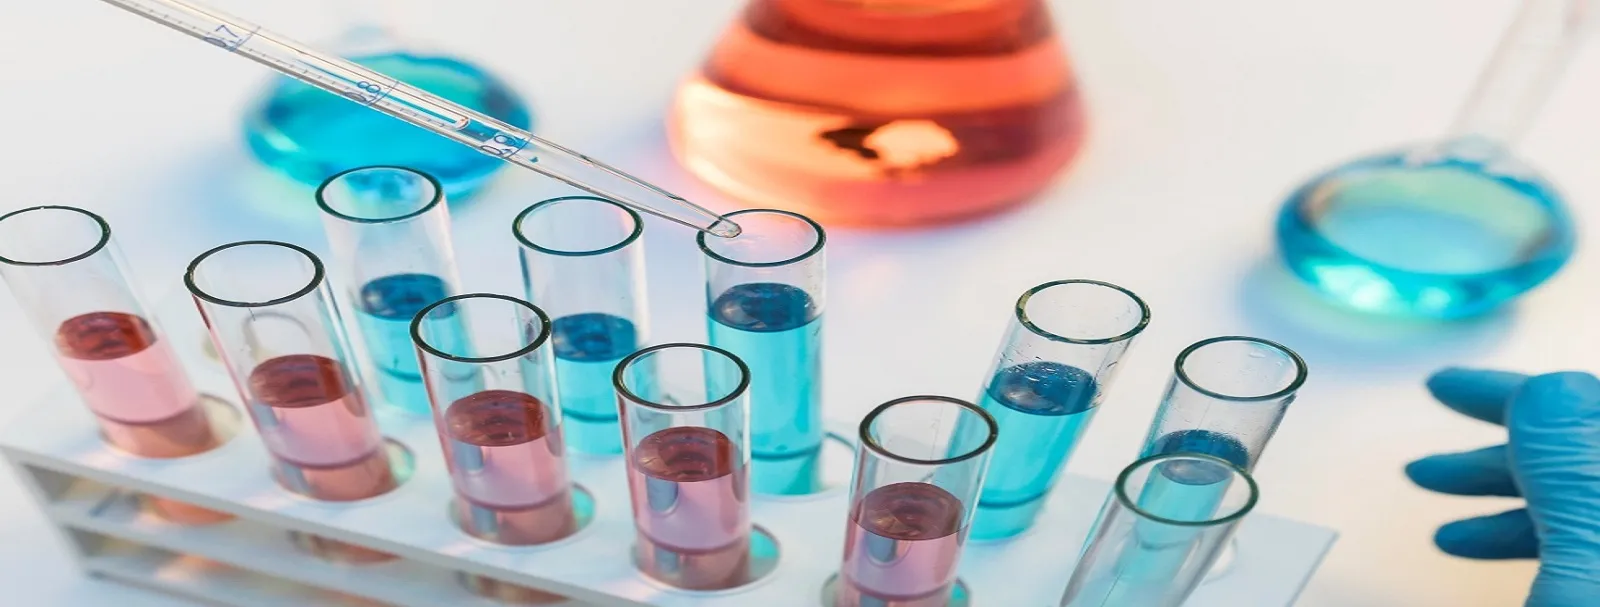
Water treatment chemicals are crucial for purifying water in municipal, industrial, and agricultural systems. These include coagulants, disinfectants, pH adjusters, corrosion inhibitors, and more. In 2025, the market is rapidly expanding due to rising global water stress, industrial growth, and stricter environmental regulations.
Market Drivers: What's Fueling the Water Treatment Chemicals Market Boom?
Urbanization and Water Scarcity: Growing populations and limited freshwater sources are boosting demand for efficient chemical treatment in cities.
Industrial Wastewater Treatment: Manufacturing, oil & gas, and power generation sectors require chemical solutions to meet discharge and recycling standards.
Environmental and Health Concerns: Greater awareness of waterborne diseases and pollutants is leading to increased chemical usage in potable water treatment.
Innovation in Focus: How Manufacturers Are Raising the Bar
Green Chemistry Formulations: Non-toxic, biodegradable chemicals are being developed for safer use in agriculture and residential water systems.
Integrated Treatment Systems: Blended chemicals and smart dosing solutions are improving performance and reducing operational costs.
Advanced Monitoring Technologies: Digital sensors and cloud-connected dosing systems ensure optimized chemical usage and compliance.
Regional Breakdown: Where the Market is Growing Fastest
Asia-Pacific: Massive infrastructure development and population growth are driving high demand in India, China, and Southeast Asia.
North America: Industrial compliance and municipal upgrades are boosting consumption of treatment chemicals in the U.S. and Canada.
Middle East and Africa: Investment in desalination and wastewater reuse technologies is pushing growth in this water-stressed region.
Strategic Considerations: How to Succeed in the Water Treatment Chemicals Market 2025
Prioritize Eco-Friendly Products: Governments and industries are favoring low-toxicity and sustainable water treatment solutions.
Develop Industry-Specific Blends: Tailored chemical packages for sectors like oil & gas, food processing, and electronics can drive differentiation.
Offer Value-Added Services: Providing technical support and dosing optimization tools can strengthen long-term client relationships.
Conclusion: The Water Treatment Chemicals Market 2025 - Enabling a Cleaner, Safer Future
Water is the world’s most valuable resource - and the chemicals that treat it are mission-critical. In 2025, success will go to suppliers that blend innovation, sustainability, and application-specific solutions to meet rising global demand.
Key Market Players
- Solenis
- SNF Group
- Ecolab
- Veolia
- Kemira
- Kurita Water Industries
- Chemtrade Logistics
- Shandong Taihe
- Dow
- Italmatch AWS
- Henan Qingshuiyuan Technology
- Feralco Group
- USALCO
- Ixom Watercare
- Changlong Tech
- Jianheng Industry
- Nouryon
- Nantong Uniphos Chemicals
- Grupo Bauminas
- Aditya Birla Chemicals
- PT Lautan Luas Tbk
- Holland Company
Segmentation By Type
- Ph Adjusters & Softeners
- Flocculants & Coagulants
- Corrosion Inhibitors
- Scale Inhibitors/Dispersants
- Biocides & Disinfectants
- Others
Segmentation By Application
- Municipal Water Treatment
- Papermaking Waste Water Treatment
- Metal & Mining Industry
- Oil & Gas industry
- Others
Segmentation By Region
- North America (United States, Canada, and Mexico)
- Europe (Germany, France, UK, Russia, Italy, and Rest of Europe)
- Asia-Pacific (China, Japan, South Korea, India, Southeast Asia, Australia and Rest of Asia-Pacific)
- South America (Brazil, Argentina and Rest of South America)
- Middle East & Africa (Turkey, Saudi Arabia, UAE, Rest of Middle East & Africa)
Market SWOT Analysis
What are the strengths of the Water Treatment Chemicals Market in 2025?
The water treatment chemicals market benefits from increasing global demand for clean and safe drinking water, as well as the growing awareness of water pollution. The market is also driven by industries such as oil and gas, food and beverage, and municipal utilities, all requiring efficient water treatment solutions. Innovations in chemical formulations to enhance performance and reduce environmental impact are strong market drivers.
What are the weaknesses of the Water Treatment Chemicals Market in 2025?
The high cost of water treatment chemicals, along with fluctuating raw material prices, can hinder market growth. There is also a lack of standardization across the industry, making it difficult for customers to choose the most effective products. Furthermore, stringent regulations in certain regions can create barriers to market entry and increase operational costs.
What are the opportunities for the Water Treatment Chemicals Market in 2025?
Opportunities lie in the increasing adoption of water recycling and wastewater treatment systems, especially in water-scarce regions. Additionally, innovations in eco-friendly and sustainable chemicals present an opportunity to appeal to environmentally conscious consumers and businesses. The rise of industrial and municipal upgrades also boosts demand for water treatment solutions.
What are the threats to the Water Treatment Chemicals Market in 2025?
Regulatory changes regarding chemical usage, environmental concerns, and potential toxicity of certain treatment chemicals pose a threat. The growing trend toward alternative water treatment technologies, such as UV or ozone treatment, could further challenge the chemical market. Additionally, fluctuating water demand due to climate change may create market instability.
Market PESTEL Analysis
How do political factors impact the Water Treatment Chemicals Market in 2025?
Political factors, including government policies on environmental regulations and water management, will significantly affect the water treatment chemicals market. Governments' efforts to improve water quality standards and manage water scarcity will increase the demand for chemical solutions in municipal and industrial water treatment plants. Political pressure for cleaner water and stricter regulations on wastewater discharge will also drive the adoption of advanced water treatment chemicals.
What economic factors affect the Water Treatment Chemicals Market in 2025?
Economic factors such as the growth of industrialization and urbanization will drive the demand for water treatment chemicals. The rising industrial demand for clean water and the need to treat wastewater effectively will create new market opportunities. Economic stability and the overall healthcare and environmental spending will also influence water treatment projects, affecting both public and private sector investment in water purification and treatment solutions.
How do social factors shape the Water Treatment Chemicals Market in 2025?
Social factors, including growing concerns over water pollution, health, and environmental sustainability, will drive the water treatment chemicals market. Consumers' increasing awareness of the need for safe, clean water will lead to higher demand for treatment solutions in both residential and commercial sectors. Social trends emphasizing eco-friendly practices and sustainability will also push industries to adopt greener and safer chemicals for water purification.
What technological factors are relevant to the Water Treatment Chemicals Market in 2025?
Technological advancements in water purification, filtration, and chemical treatment technologies will significantly impact the water treatment chemicals market. Innovations in membrane filtration technologies, advanced oxidation processes, and chemical dosing systems will improve the efficiency and effectiveness of water treatment chemicals. Additionally, digitalization and automation in water treatment plants, including real-time monitoring and data analysis, will optimize the use of chemicals in water treatment processes.
What environmental factors influence the Water Treatment Chemicals Market in 2025?
Environmental factors such as increasing concerns about water pollution, climate change, and water scarcity will drive the need for effective water treatment chemicals. The growing awareness of environmental sustainability and the need to reduce water consumption will encourage the development of more efficient and eco-friendly chemicals for water treatment. Additionally, stricter environmental regulations governing wastewater discharge and drinking water quality will contribute to the demand for water treatment solutions.
How do legal factors impact the Water Treatment Chemicals Market in 2025?
Legal factors, including regulations surrounding water quality, wastewater discharge, and the safety of chemicals used in water treatment, will impact the market. Governments are likely to enforce stricter standards for water treatment, including the use of non-toxic chemicals and environmentally friendly products. Legal frameworks that govern industrial discharges and public water supplies will also determine the need for specific water treatment chemicals to comply with health and environmental laws.
Market SIPOC Analysis
Who are the suppliers in the Water Treatment Chemicals Market in 2025?
Suppliers in the Water Treatment Chemicals market include chemical manufacturers that produce coagulants, flocculants, disinfectants, and corrosion inhibitors. Companies specializing in custom formulations for industrial, municipal, and residential water treatment systems are also key suppliers. Logistics providers and distributors also play a role in getting the chemicals to various end-use industries.
What are the inputs in the Water Treatment Chemicals Market in 2025?
Inputs include raw materials such as chlorine, aluminum sulfate, and polymers used in the production of water treatment chemicals. Energy for production and distribution, along with specialized equipment for water treatment, are essential inputs. Regulatory requirements for safe and environmentally friendly chemicals are also key factors in the input process.
What processes are involved in the Water Treatment Chemicals Market in 2025?
The processes include the formulation and manufacturing of various water treatment chemicals, such as coagulants, disinfectants, and pH control agents. These chemicals are tested for their effectiveness in purifying and treating water. The chemicals are then packaged and distributed to municipal water treatment plants, industrial facilities, and residential customers.
Who are the customers in the Water Treatment Chemicals Market in 2025?
Customers include municipal water treatment plants, industries such as power generation, paper and pulp, food and beverage, and oil and gas, as well as residential customers who use water treatment chemicals for home purification systems. Environmental organizations and government bodies involved in water regulation also influence demand in the market.
What are the outcomes in the Water Treatment Chemicals Market in 2025?
The outcomes include improved water quality and enhanced efficiency in water treatment processes. The use of water treatment chemicals leads to better control of contaminants, ensuring safe and clean drinking water. The market will grow as water scarcity issues increase globally, prompting the demand for more advanced and sustainable water treatment solutions.
Market Porter's Five Forces
What is the threat of new entrants in the Water Treatment Chemicals Market 2025?
The threat of new entrants is moderate. The water treatment chemicals market requires significant investment in research and development, manufacturing capabilities, and compliance with environmental regulations. Established companies have strong brand recognition and customer loyalty, which creates barriers for new entrants, though opportunities exist for companies offering innovative or eco-friendly solutions.
What is the bargaining power of suppliers in the Water Treatment Chemicals Market 2025?
The bargaining power of suppliers is moderate. While raw materials for water treatment chemicals are widely available, suppliers of specialized or proprietary chemicals have more power. However, competition among suppliers and the availability of alternative raw materials reduce their overall influence.
What is the bargaining power of buyers in the Water Treatment Chemicals Market 2025?
The bargaining power of buyers is high. Water treatment chemicals are essential to industries like utilities, food and beverage, and manufacturing, giving buyers significant leverage. Large buyers can negotiate better pricing and terms due to their purchasing volume, while smaller buyers benefit from a wide variety of options.
What is the threat of substitute products in the Water Treatment Chemicals Market 2025?
The threat of substitutes is moderate. While some alternatives, such as mechanical filtration or alternative chemical solutions, can be used for water treatment, chemicals still offer the most effective and cost-efficient method for many industries. However, increasing demand for environmentally friendly substitutes may pose a growing threat.
What is the intensity of competitive rivalry in the Water Treatment Chemicals Market 2025?
The intensity of competitive rivalry is high. The market is highly competitive, with numerous players offering similar products. Companies differentiate themselves by offering specialized solutions for various industries, focusing on cost efficiency, quality, and regulatory compliance. The increasing demand for advanced and eco-friendly solutions will intensify competition further.
Market Upstream Analysis
What are the key raw materials in the Water Treatment Chemicals Market in 2025?
The key raw materials in the water treatment chemicals market include coagulants like aluminum sulfate, flocculants, disinfectants like chlorine, and pH adjusters such as lime and sodium hydroxide. These chemicals are used in water purification processes for both industrial and municipal applications.
What role do suppliers play in the Water Treatment Chemicals Market in 2025?
Suppliers provide the raw materials required to produce water treatment chemicals that are used in municipal and industrial water purification. They are responsible for ensuring the quality, consistency, and effectiveness of these chemicals, which play a crucial role in making water safe for consumption, irrigation, and industrial use. Suppliers must also stay up-to-date with changing regulations and emerging technologies in the water treatment industry.
How does the regulatory environment affect upstream factors in this market?
Regulations governing water quality and safety standards directly impact the water treatment chemicals market. Suppliers must comply with stringent guidelines from environmental agencies, such as the EPA and WHO, to ensure that chemicals used in water treatment do not pose a risk to human health or the environment. Regulations on the production and disposal of water treatment chemicals can also affect supply chains.
What technological advancements influence upstream production in the Water Treatment Chemicals Market in 2025?
Technological advancements in chemical formulations, such as the development of more efficient and eco-friendly coagulants and disinfectants, are shaping the market. Innovations in water treatment processes, such as advanced filtration systems and real-time monitoring technologies, are also influencing the demand for specific water treatment chemicals. These technologies are driving the development of smarter, more sustainable water treatment solutions.
What challenges do upstream suppliers face in this market?
Suppliers face challenges related to the increasing demand for sustainable and eco-friendly water treatment chemicals. The need to develop products that meet stricter environmental and health standards requires ongoing research and development. Additionally, fluctuations in raw material costs, supply chain disruptions, and regulatory changes present ongoing challenges for suppliers in the water treatment chemicals market.
Market Midstream Analysis
What are the key processes involved in the midstream of the Water Treatment Chemicals Market in 2025?
Key processes include the formulation, production, and distribution of water treatment chemicals, such as coagulants, flocculants, and disinfectants. Manufacturers focus on developing effective chemical solutions for municipal and industrial water treatment to ensure safe drinking water and clean wastewater management.
How do manufacturers contribute to the Water Treatment Chemicals Market in 2025?
Manufacturers produce water treatment chemicals by developing specialized formulations for different water qualities and treatment needs. They continually innovate to create chemicals that improve efficiency, reduce environmental impact, and meet regulatory standards for water treatment and safety.
What is the role of packaging in the midstream of this market?
Packaging ensures that water treatment chemicals are protected from contamination, moisture, and degradation during transportation and storage. Proper packaging also ensures safe handling and correct application of chemicals by water treatment facilities and industrial operators.
What challenges do companies face in the midstream of this market?
Challenges include managing the complex regulatory requirements related to water treatment, ensuring the efficacy of chemicals across varying water qualities, and addressing the increasing demand for sustainable and eco-friendly solutions. Companies must also navigate fluctuations in raw material costs and supply chain disruptions.
How do distribution channels affect the Water Treatment Chemicals Market in 2025?
Distribution channels are vital for ensuring timely delivery of water treatment chemicals to municipalities and industries. Reliable and efficient logistics are essential to meet the urgent needs of water treatment plants, ensuring access to necessary chemicals for treating and purifying water in both urban and industrial settings.
Market Downstream Analysis
What are the key consumer segments in the Water Treatment Chemicals Market in 2025?
Key consumer segments in the Water Treatment Chemicals market include municipal water treatment facilities, industrial water treatment plants, and the oil & gas industry. Additionally, sectors like food and beverage, paper and pulp, and power generation also rely on water treatment chemicals to ensure water quality and meet regulatory requirements.
How do suppliers and distributors contribute to the Water Treatment Chemicals Market in 2025?
Suppliers provide essential chemicals such as coagulants, disinfectants, and flocculants that help in the treatment of water. Distributors ensure the efficient delivery of these chemicals to end-users, enabling them to maintain water quality for consumption and industrial use. Their role is vital in ensuring timely availability, particularly in industries with high water usage.
What role does consumer education play in the downstream market for Water Treatment Chemicals in 2025?
Consumer education helps raise awareness about the importance of water treatment for both environmental sustainability and public health. By informing industries about the need for effective water management and the benefits of using advanced chemicals, consumer education can drive increased adoption and encourage the use of safer, more efficient water treatment methods.
What challenges do companies face in the downstream market of this industry?
Challenges include addressing the growing regulatory pressures surrounding the use of chemicals in water treatment. Companies must also find cost-effective solutions while managing the environmental impact of the chemicals. Moreover, competition from alternative water treatment technologies and the need for continuous product innovation are significant challenges.
How does consumer feedback influence the Water Treatment Chemicals Market in 2025?
Consumer feedback in water treatment helps companies develop and refine products that meet industry-specific requirements. Feedback regarding the performance, safety, and environmental impact of water treatment chemicals can guide manufacturers in improving formulations. Positive consumer feedback about performance can also strengthen brand loyalty and increase market share.
Chapter 1, to describe Water Treatment Chemicals product scope, market overview, market estimation caveats and base year.
Chapter 2, to profile the top players of Water Treatment Chemicals, with revenue, gross margin and global market share of Water Treatment Chemicals from 2018 to 2023.
Chapter 3, the Water Treatment Chemicals competitive situation, revenue and global market share of top players are analyzed emphatically by landscape contrast.
Chapter 4 and 5, to segment the market size by Type and application, with consumption value and growth rate by Type, application, from 2018 to 2029.
Chapter 6, 7, 8, 9, and 10, to break the market size data at the country level, with revenue and market share for key countries in the world, from 2018 to 2023.and Water Treatment Chemicals market forecast, by regions, type and application, with consumption value, from 2024 to 2029.
Chapter 11, market dynamics, drivers, restraints, trends, Porters Five Forces analysis, and Influence of COVID-19 and Russia-Ukraine War
Chapter 12, the key raw materials and key suppliers, and industry chain of Water Treatment Chemicals.
Chapter 13, to describe Water Treatment Chemicals research findings and conclusion.
1 Market Overview
1.1 Product Overview and Scope of Water Treatment Chemicals
1.2 Market Estimation Caveats and Base Year
1.3 Classification of Water Treatment Chemicals by Type
1.3.1 Overview: Global Water Treatment Chemicals Market Size by Type: 2018 Versus 2022 Versus 2029
1.3.2 Global Water Treatment Chemicals Consumption Value Market Share by Type in 2022
1.3.3 Ph Adjusters & Softeners
1.3.4 Flocculants & Coagulants
1.3.5 Corrosion Inhibitors
1.3.6 Scale Inhibitors/Dispersants
1.3.7 Biocides & Disinfectants
1.3.8 Others
1.4 Global Water Treatment Chemicals Market by Application
1.4.1 Overview: Global Water Treatment Chemicals Market Size by Application: 2018 Versus 2022 Versus 2029
1.4.2 Municipal Water Treatment
1.4.3 Papermaking Waste Water Treatment
1.4.4 Metal & Mining Industry
1.4.5 Oil & Gas industry
1.4.6 Others
1.5 Global Water Treatment Chemicals Market Size & Forecast
1.6 Global Water Treatment Chemicals Market Size and Forecast by Region
1.6.1 Global Water Treatment Chemicals Market Size by Region: 2018 VS 2022 VS 2029
1.6.2 Global Water Treatment Chemicals Market Size by Region, (2018-2029)
1.6.3 North America Water Treatment Chemicals Market Size and Prospect (2018-2029)
1.6.4 Europe Water Treatment Chemicals Market Size and Prospect (2018-2029)
1.6.5 Asia-Pacific Water Treatment Chemicals Market Size and Prospect (2018-2029)
1.6.6 South America Water Treatment Chemicals Market Size and Prospect (2018-2029)
1.6.7 Middle East and Africa Water Treatment Chemicals Market Size and Prospect (2018-2029)
2 Company Profiles
2.1 Solenis
2.1.1 Solenis Details
2.1.2 Solenis Major Business
2.1.3 Solenis Water Treatment Chemicals Product and Solutions
2.1.4 Solenis Water Treatment Chemicals Revenue, Gross Margin and Market Share (2018-2023)
2.1.5 Solenis Recent Developments and Future Plans
2.2 SNF Group
2.2.1 SNF Group Details
2.2.2 SNF Group Major Business
2.2.3 SNF Group Water Treatment Chemicals Product and Solutions
2.2.4 SNF Group Water Treatment Chemicals Revenue, Gross Margin and Market Share (2018-2023)
2.2.5 SNF Group Recent Developments and Future Plans
2.3 Ecolab
2.3.1 Ecolab Details
2.3.2 Ecolab Major Business
2.3.3 Ecolab Water Treatment Chemicals Product and Solutions
2.3.4 Ecolab Water Treatment Chemicals Revenue, Gross Margin and Market Share (2018-2023)
2.3.5 Ecolab Recent Developments and Future Plans
2.4 Veolia
2.4.1 Veolia Details
2.4.2 Veolia Major Business
2.4.3 Veolia Water Treatment Chemicals Product and Solutions
2.4.4 Veolia Water Treatment Chemicals Revenue, Gross Margin and Market Share (2018-2023)
2.4.5 Veolia Recent Developments and Future Plans
2.5 Kemira
2.5.1 Kemira Details
2.5.2 Kemira Major Business
2.5.3 Kemira Water Treatment Chemicals Product and Solutions
2.5.4 Kemira Water Treatment Chemicals Revenue, Gross Margin and Market Share (2018-2023)
2.5.5 Kemira Recent Developments and Future Plans
2.6 Kurita Water Industries
2.6.1 Kurita Water Industries Details
2.6.2 Kurita Water Industries Major Business
2.6.3 Kurita Water Industries Water Treatment Chemicals Product and Solutions
2.6.4 Kurita Water Industries Water Treatment Chemicals Revenue, Gross Margin and Market Share (2018-2023)
2.6.5 Kurita Water Industries Recent Developments and Future Plans
2.7 Chemtrade Logistics
2.7.1 Chemtrade Logistics Details
2.7.2 Chemtrade Logistics Major Business
2.7.3 Chemtrade Logistics Water Treatment Chemicals Product and Solutions
2.7.4 Chemtrade Logistics Water Treatment Chemicals Revenue, Gross Margin and Market Share (2018-2023)
2.7.5 Chemtrade Logistics Recent Developments and Future Plans
2.8 Shandong Taihe
2.8.1 Shandong Taihe Details
2.8.2 Shandong Taihe Major Business
2.8.3 Shandong Taihe Water Treatment Chemicals Product and Solutions
2.8.4 Shandong Taihe Water Treatment Chemicals Revenue, Gross Margin and Market Share (2018-2023)
2.8.5 Shandong Taihe Recent Developments and Future Plans
2.9 Dow
2.9.1 Dow Details
2.9.2 Dow Major Business
2.9.3 Dow Water Treatment Chemicals Product and Solutions
2.9.4 Dow Water Treatment Chemicals Revenue, Gross Margin and Market Share (2018-2023)
2.9.5 Dow Recent Developments and Future Plans
2.10 Italmatch AWS
2.10.1 Italmatch AWS Details
2.10.2 Italmatch AWS Major Business
2.10.3 Italmatch AWS Water Treatment Chemicals Product and Solutions
2.10.4 Italmatch AWS Water Treatment Chemicals Revenue, Gross Margin and Market Share (2018-2023)
2.10.5 Italmatch AWS Recent Developments and Future Plans
2.11 Henan Qingshuiyuan Technology
2.11.1 Henan Qingshuiyuan Technology Details
2.11.2 Henan Qingshuiyuan Technology Major Business
2.11.3 Henan Qingshuiyuan Technology Water Treatment Chemicals Product and Solutions
2.11.4 Henan Qingshuiyuan Technology Water Treatment Chemicals Revenue, Gross Margin and Market Share (2018-2023)
2.11.5 Henan Qingshuiyuan Technology Recent Developments and Future Plans
2.12 Feralco Group
2.12.1 Feralco Group Details
2.12.2 Feralco Group Major Business
2.12.3 Feralco Group Water Treatment Chemicals Product and Solutions
2.12.4 Feralco Group Water Treatment Chemicals Revenue, Gross Margin and Market Share (2018-2023)
2.12.5 Feralco Group Recent Developments and Future Plans
2.13 USALCO
2.13.1 USALCO Details
2.13.2 USALCO Major Business
2.13.3 USALCO Water Treatment Chemicals Product and Solutions
2.13.4 USALCO Water Treatment Chemicals Revenue, Gross Margin and Market Share (2018-2023)
2.13.5 USALCO Recent Developments and Future Plans
2.14 Ixom Watercare
2.14.1 Ixom Watercare Details
2.14.2 Ixom Watercare Major Business
2.14.3 Ixom Watercare Water Treatment Chemicals Product and Solutions
2.14.4 Ixom Watercare Water Treatment Chemicals Revenue, Gross Margin and Market Share (2018-2023)
2.14.5 Ixom Watercare Recent Developments and Future Plans
2.15 Changlong Tech
2.15.1 Changlong Tech Details
2.15.2 Changlong Tech Major Business
2.15.3 Changlong Tech Water Treatment Chemicals Product and Solutions
2.15.4 Changlong Tech Water Treatment Chemicals Revenue, Gross Margin and Market Share (2018-2023)
2.15.5 Changlong Tech Recent Developments and Future Plans
2.16 Jianheng Industry
2.16.1 Jianheng Industry Details
2.16.2 Jianheng Industry Major Business
2.16.3 Jianheng Industry Water Treatment Chemicals Product and Solutions
2.16.4 Jianheng Industry Water Treatment Chemicals Revenue, Gross Margin and Market Share (2018-2023)
2.16.5 Jianheng Industry Recent Developments and Future Plans
2.17 Nouryon
2.17.1 Nouryon Details
2.17.2 Nouryon Major Business
2.17.3 Nouryon Water Treatment Chemicals Product and Solutions
2.17.4 Nouryon Water Treatment Chemicals Revenue, Gross Margin and Market Share (2018-2023)
2.17.5 Nouryon Recent Developments and Future Plans
2.18 Nantong Uniphos Chemicals
2.18.1 Nantong Uniphos Chemicals Details
2.18.2 Nantong Uniphos Chemicals Major Business
2.18.3 Nantong Uniphos Chemicals Water Treatment Chemicals Product and Solutions
2.18.4 Nantong Uniphos Chemicals Water Treatment Chemicals Revenue, Gross Margin and Market Share (2018-2023)
2.18.5 Nantong Uniphos Chemicals Recent Developments and Future Plans
2.19 Grupo Bauminas
2.19.1 Grupo Bauminas Details
2.19.2 Grupo Bauminas Major Business
2.19.3 Grupo Bauminas Water Treatment Chemicals Product and Solutions
2.19.4 Grupo Bauminas Water Treatment Chemicals Revenue, Gross Margin and Market Share (2018-2023)
2.19.5 Grupo Bauminas Recent Developments and Future Plans
2.20 Aditya Birla Chemicals
2.20.1 Aditya Birla Chemicals Details
2.20.2 Aditya Birla Chemicals Major Business
2.20.3 Aditya Birla Chemicals Water Treatment Chemicals Product and Solutions
2.20.4 Aditya Birla Chemicals Water Treatment Chemicals Revenue, Gross Margin and Market Share (2018-2023)
2.20.5 Aditya Birla Chemicals Recent Developments and Future Plans
2.21 PT Lautan Luas Tbk
2.21.1 PT Lautan Luas Tbk Details
2.21.2 PT Lautan Luas Tbk Major Business
2.21.3 PT Lautan Luas Tbk Water Treatment Chemicals Product and Solutions
2.21.4 PT Lautan Luas Tbk Water Treatment Chemicals Revenue, Gross Margin and Market Share (2018-2023)
2.21.5 PT Lautan Luas Tbk Recent Developments and Future Plans
2.22 Holland Company
2.22.1 Holland Company Details
2.22.2 Holland Company Major Business
2.22.3 Holland Company Water Treatment Chemicals Product and Solutions
2.22.4 Holland Company Water Treatment Chemicals Revenue, Gross Margin and Market Share (2018-2023)
2.22.5 Holland Company Recent Developments and Future Plans
3 Market Competition, by Players
3.1 Global Water Treatment Chemicals Revenue and Share by Players (2018-2023)
3.2 Market Share Analysis (2022)
3.2.1 Market Share of Water Treatment Chemicals by Company Revenue
3.2.2 Top 3 Water Treatment Chemicals Players Market Share in 2022
3.2.3 Top 6 Water Treatment Chemicals Players Market Share in 2022
3.3 Water Treatment Chemicals Market: Overall Company Footprint Analysis
3.3.1 Water Treatment Chemicals Market: Region Footprint
3.3.2 Water Treatment Chemicals Market: Company Product Type Footprint
3.3.3 Water Treatment Chemicals Market: Company Product Application Footprint
3.4 New Market Entrants and Barriers to Market Entry
3.5 Mergers, Acquisition, Agreements, and Collaborations
4 Market Size Segment by Type
4.1 Global Water Treatment Chemicals Consumption Value and Market Share by Type (2018-2023)
4.2 Global Water Treatment Chemicals Market Forecast by Type (2024-2029)
5 Market Size Segment by Application
5.1 Global Water Treatment Chemicals Consumption Value Market Share by Application (2018-2023)
5.2 Global Water Treatment Chemicals Market Forecast by Application (2024-2029)
6 North America
6.1 North America Water Treatment Chemicals Consumption Value by Type (2018-2029)
6.2 North America Water Treatment Chemicals Consumption Value by Application (2018-2029)
6.3 North America Water Treatment Chemicals Market Size by Country
6.3.1 North America Water Treatment Chemicals Consumption Value by Country (2018-2029)
6.3.2 United States Water Treatment Chemicals Market Size and Forecast (2018-2029)
6.3.3 Canada Water Treatment Chemicals Market Size and Forecast (2018-2029)
6.3.4 Mexico Water Treatment Chemicals Market Size and Forecast (2018-2029)
7 Europe
7.1 Europe Water Treatment Chemicals Consumption Value by Type (2018-2029)
7.2 Europe Water Treatment Chemicals Consumption Value by Application (2018-2029)
7.3 Europe Water Treatment Chemicals Market Size by Country
7.3.1 Europe Water Treatment Chemicals Consumption Value by Country (2018-2029)
7.3.2 Germany Water Treatment Chemicals Market Size and Forecast (2018-2029)
7.3.3 France Water Treatment Chemicals Market Size and Forecast (2018-2029)
7.3.4 United Kingdom Water Treatment Chemicals Market Size and Forecast (2018-2029)
7.3.5 Russia Water Treatment Chemicals Market Size and Forecast (2018-2029)
7.3.6 Italy Water Treatment Chemicals Market Size and Forecast (2018-2029)
8 Asia-Pacific
8.1 Asia-Pacific Water Treatment Chemicals Consumption Value by Type (2018-2029)
8.2 Asia-Pacific Water Treatment Chemicals Consumption Value by Application (2018-2029)
8.3 Asia-Pacific Water Treatment Chemicals Market Size by Region
8.3.1 Asia-Pacific Water Treatment Chemicals Consumption Value by Region (2018-2029)
8.3.2 China Water Treatment Chemicals Market Size and Forecast (2018-2029)
8.3.3 Japan Water Treatment Chemicals Market Size and Forecast (2018-2029)
8.3.4 South Korea Water Treatment Chemicals Market Size and Forecast (2018-2029)
8.3.5 India Water Treatment Chemicals Market Size and Forecast (2018-2029)
8.3.6 Southeast Asia Water Treatment Chemicals Market Size and Forecast (2018-2029)
8.3.7 Australia Water Treatment Chemicals Market Size and Forecast (2018-2029)
9 South America
9.1 South America Water Treatment Chemicals Consumption Value by Type (2018-2029)
9.2 South America Water Treatment Chemicals Consumption Value by Application (2018-2029)
9.3 South America Water Treatment Chemicals Market Size by Country
9.3.1 South America Water Treatment Chemicals Consumption Value by Country (2018-2029)
9.3.2 Brazil Water Treatment Chemicals Market Size and Forecast (2018-2029)
9.3.3 Argentina Water Treatment Chemicals Market Size and Forecast (2018-2029)
10 Middle East & Africa
10.1 Middle East & Africa Water Treatment Chemicals Consumption Value by Type (2018-2029)
10.2 Middle East & Africa Water Treatment Chemicals Consumption Value by Application (2018-2029)
10.3 Middle East & Africa Water Treatment Chemicals Market Size by Country
10.3.1 Middle East & Africa Water Treatment Chemicals Consumption Value by Country (2018-2029)
10.3.2 Turkey Water Treatment Chemicals Market Size and Forecast (2018-2029)
10.3.3 Saudi Arabia Water Treatment Chemicals Market Size and Forecast (2018-2029)
10.3.4 UAE Water Treatment Chemicals Market Size and Forecast (2018-2029)
11 Market Dynamics
11.1 Water Treatment Chemicals Market Drivers
11.2 Water Treatment Chemicals Market Restraints
11.3 Water Treatment Chemicals Trends Analysis
11.4 Porters Five Forces Analysis
11.4.1 Threat of New Entrants
11.4.2 Bargaining Power of Suppliers
11.4.3 Bargaining Power of Buyers
11.4.4 Threat of Substitutes
11.4.5 Competitive Rivalry
11.5 Influence of COVID-19 and Russia-Ukraine War
11.5.1 Influence of COVID-19
11.5.2 Influence of Russia-Ukraine War
12 Industry Chain Analysis
12.1 Water Treatment Chemicals Industry Chain
12.2 Water Treatment Chemicals Upstream Analysis
12.3 Water Treatment Chemicals Midstream Analysis
12.4 Water Treatment Chemicals Downstream Analysis
13 Research Findings and Conclusion
14 Appendix
14.1 Methodology
14.2 Research Process and Data Source
14.3 Disclaimer
List of Tables
Table 1. Global Water Treatment Chemicals Consumption Value by Type, (USD Million), 2018 & 2022 & 2029
Table 2. Global Water Treatment Chemicals Consumption Value by Application, (USD Million), 2018 & 2022 & 2029
Table 3. Global Water Treatment Chemicals Consumption Value by Region (2018-2023) & (USD Million)
Table 4. Global Water Treatment Chemicals Consumption Value by Region (2024-2029) & (USD Million)
Table 5. Solenis Company Information, Head Office, and Major Competitors
Table 6. Solenis Major Business
Table 7. Solenis Water Treatment Chemicals Product and Solutions
Table 8. Solenis Water Treatment Chemicals Revenue (USD Million), Gross Margin and Market Share (2018-2023)
Table 9. Solenis Recent Developments and Future Plans
Table 10. SNF Group Company Information, Head Office, and Major Competitors
Table 11. SNF Group Major Business
Table 12. SNF Group Water Treatment Chemicals Product and Solutions
Table 13. SNF Group Water Treatment Chemicals Revenue (USD Million), Gross Margin and Market Share (2018-2023)
Table 14. SNF Group Recent Developments and Future Plans
Table 15. Ecolab Company Information, Head Office, and Major Competitors
Table 16. Ecolab Major Business
Table 17. Ecolab Water Treatment Chemicals Product and Solutions
Table 18. Ecolab Water Treatment Chemicals Revenue (USD Million), Gross Margin and Market Share (2018-2023)
Table 19. Ecolab Recent Developments and Future Plans
Table 20. Veolia Company Information, Head Office, and Major Competitors
Table 21. Veolia Major Business
Table 22. Veolia Water Treatment Chemicals Product and Solutions
Table 23. Veolia Water Treatment Chemicals Revenue (USD Million), Gross Margin and Market Share (2018-2023)
Table 24. Veolia Recent Developments and Future Plans
Table 25. Kemira Company Information, Head Office, and Major Competitors
Table 26. Kemira Major Business
Table 27. Kemira Water Treatment Chemicals Product and Solutions
Table 28. Kemira Water Treatment Chemicals Revenue (USD Million), Gross Margin and Market Share (2018-2023)
Table 29. Kemira Recent Developments and Future Plans
Table 30. Kurita Water Industries Company Information, Head Office, and Major Competitors
Table 31. Kurita Water Industries Major Business
Table 32. Kurita Water Industries Water Treatment Chemicals Product and Solutions
Table 33. Kurita Water Industries Water Treatment Chemicals Revenue (USD Million), Gross Margin and Market Share (2018-2023)
Table 34. Kurita Water Industries Recent Developments and Future Plans
Table 35. Chemtrade Logistics Company Information, Head Office, and Major Competitors
Table 36. Chemtrade Logistics Major Business
Table 37. Chemtrade Logistics Water Treatment Chemicals Product and Solutions
Table 38. Chemtrade Logistics Water Treatment Chemicals Revenue (USD Million), Gross Margin and Market Share (2018-2023)
Table 39. Chemtrade Logistics Recent Developments and Future Plans
Table 40. Shandong Taihe Company Information, Head Office, and Major Competitors
Table 41. Shandong Taihe Major Business
Table 42. Shandong Taihe Water Treatment Chemicals Product and Solutions
Table 43. Shandong Taihe Water Treatment Chemicals Revenue (USD Million), Gross Margin and Market Share (2018-2023)
Table 44. Shandong Taihe Recent Developments and Future Plans
Table 45. Dow Company Information, Head Office, and Major Competitors
Table 46. Dow Major Business
Table 47. Dow Water Treatment Chemicals Product and Solutions
Table 48. Dow Water Treatment Chemicals Revenue (USD Million), Gross Margin and Market Share (2018-2023)
Table 49. Dow Recent Developments and Future Plans
Table 50. Italmatch AWS Company Information, Head Office, and Major Competitors
Table 51. Italmatch AWS Major Business
Table 52. Italmatch AWS Water Treatment Chemicals Product and Solutions
Table 53. Italmatch AWS Water Treatment Chemicals Revenue (USD Million), Gross Margin and Market Share (2018-2023)
Table 54. Italmatch AWS Recent Developments and Future Plans
Table 55. Henan Qingshuiyuan Technology Company Information, Head Office, and Major Competitors
Table 56. Henan Qingshuiyuan Technology Major Business
Table 57. Henan Qingshuiyuan Technology Water Treatment Chemicals Product and Solutions
Table 58. Henan Qingshuiyuan Technology Water Treatment Chemicals Revenue (USD Million), Gross Margin and Market Share (2018-2023)
Table 59. Henan Qingshuiyuan Technology Recent Developments and Future Plans
Table 60. Feralco Group Company Information, Head Office, and Major Competitors
Table 61. Feralco Group Major Business
Table 62. Feralco Group Water Treatment Chemicals Product and Solutions
Table 63. Feralco Group Water Treatment Chemicals Revenue (USD Million), Gross Margin and Market Share (2018-2023)
Table 64. Feralco Group Recent Developments and Future Plans
Table 65. USALCO Company Information, Head Office, and Major Competitors
Table 66. USALCO Major Business
Table 67. USALCO Water Treatment Chemicals Product and Solutions
Table 68. USALCO Water Treatment Chemicals Revenue (USD Million), Gross Margin and Market Share (2018-2023)
Table 69. USALCO Recent Developments and Future Plans
Table 70. Ixom Watercare Company Information, Head Office, and Major Competitors
Table 71. Ixom Watercare Major Business
Table 72. Ixom Watercare Water Treatment Chemicals Product and Solutions
Table 73. Ixom Watercare Water Treatment Chemicals Revenue (USD Million), Gross Margin and Market Share (2018-2023)
Table 74. Ixom Watercare Recent Developments and Future Plans
Table 75. Changlong Tech Company Information, Head Office, and Major Competitors
Table 76. Changlong Tech Major Business
Table 77. Changlong Tech Water Treatment Chemicals Product and Solutions
Table 78. Changlong Tech Water Treatment Chemicals Revenue (USD Million), Gross Margin and Market Share (2018-2023)
Table 79. Changlong Tech Recent Developments and Future Plans
Table 80. Jianheng Industry Company Information, Head Office, and Major Competitors
Table 81. Jianheng Industry Major Business
Table 82. Jianheng Industry Water Treatment Chemicals Product and Solutions
Table 83. Jianheng Industry Water Treatment Chemicals Revenue (USD Million), Gross Margin and Market Share (2018-2023)
Table 84. Jianheng Industry Recent Developments and Future Plans
Table 85. Nouryon Company Information, Head Office, and Major Competitors
Table 86. Nouryon Major Business
Table 87. Nouryon Water Treatment Chemicals Product and Solutions
Table 88. Nouryon Water Treatment Chemicals Revenue (USD Million), Gross Margin and Market Share (2018-2023)
Table 89. Nouryon Recent Developments and Future Plans
Table 90. Nantong Uniphos Chemicals Company Information, Head Office, and Major Competitors
Table 91. Nantong Uniphos Chemicals Major Business
Table 92. Nantong Uniphos Chemicals Water Treatment Chemicals Product and Solutions
Table 93. Nantong Uniphos Chemicals Water Treatment Chemicals Revenue (USD Million), Gross Margin and Market Share (2018-2023)
Table 94. Nantong Uniphos Chemicals Recent Developments and Future Plans
Table 95. Grupo Bauminas Company Information, Head Office, and Major Competitors
Table 96. Grupo Bauminas Major Business
Table 97. Grupo Bauminas Water Treatment Chemicals Product and Solutions
Table 98. Grupo Bauminas Water Treatment Chemicals Revenue (USD Million), Gross Margin and Market Share (2018-2023)
Table 99. Grupo Bauminas Recent Developments and Future Plans
Table 100. Aditya Birla Chemicals Company Information, Head Office, and Major Competitors
Table 101. Aditya Birla Chemicals Major Business
Table 102. Aditya Birla Chemicals Water Treatment Chemicals Product and Solutions
Table 103. Aditya Birla Chemicals Water Treatment Chemicals Revenue (USD Million), Gross Margin and Market Share (2018-2023)
Table 104. Aditya Birla Chemicals Recent Developments and Future Plans
Table 105. PT Lautan Luas Tbk Company Information, Head Office, and Major Competitors
Table 106. PT Lautan Luas Tbk Major Business
Table 107. PT Lautan Luas Tbk Water Treatment Chemicals Product and Solutions
Table 108. PT Lautan Luas Tbk Water Treatment Chemicals Revenue (USD Million), Gross Margin and Market Share (2018-2023)
Table 109. PT Lautan Luas Tbk Recent Developments and Future Plans
Table 110. Holland Company Company Information, Head Office, and Major Competitors
Table 111. Holland Company Major Business
Table 112. Holland Company Water Treatment Chemicals Product and Solutions
Table 113. Holland Company Water Treatment Chemicals Revenue (USD Million), Gross Margin and Market Share (2018-2023)
Table 114. Holland Company Recent Developments and Future Plans
Table 115. Global Water Treatment Chemicals Revenue (USD Million) by Players (2018-2023)
Table 116. Global Water Treatment Chemicals Revenue Share by Players (2018-2023)
Table 117. Breakdown of Water Treatment Chemicals by Company Type (Tier 1, Tier 2, and Tier 3)
Table 118. Market Position of Players in Water Treatment Chemicals, (Tier 1, Tier 2, and Tier 3), Based on Revenue in 2022
Table 119. Head Office of Key Water Treatment Chemicals Players
Table 120. Water Treatment Chemicals Market: Company Product Type Footprint
Table 121. Water Treatment Chemicals Market: Company Product Application Footprint
Table 122. Water Treatment Chemicals New Market Entrants and Barriers to Market Entry
Table 123. Water Treatment Chemicals Mergers, Acquisition, Agreements, and Collaborations
Table 124. Global Water Treatment Chemicals Consumption Value (USD Million) by Type (2018-2023)
Table 125. Global Water Treatment Chemicals Consumption Value Share by Type (2018-2023)
Table 126. Global Water Treatment Chemicals Consumption Value Forecast by Type (2024-2029)
Table 127. Global Water Treatment Chemicals Consumption Value by Application (2018-2023)
Table 128. Global Water Treatment Chemicals Consumption Value Forecast by Application (2024-2029)
Table 129. North America Water Treatment Chemicals Consumption Value by Type (2018-2023) & (USD Million)
Table 130. North America Water Treatment Chemicals Consumption Value by Type (2024-2029) & (USD Million)
Table 131. North America Water Treatment Chemicals Consumption Value by Application (2018-2023) & (USD Million)
Table 132. North America Water Treatment Chemicals Consumption Value by Application (2024-2029) & (USD Million)
Table 133. North America Water Treatment Chemicals Consumption Value by Country (2018-2023) & (USD Million)
Table 134. North America Water Treatment Chemicals Consumption Value by Country (2024-2029) & (USD Million)
Table 135. Europe Water Treatment Chemicals Consumption Value by Type (2018-2023) & (USD Million)
Table 136. Europe Water Treatment Chemicals Consumption Value by Type (2024-2029) & (USD Million)
Table 137. Europe Water Treatment Chemicals Consumption Value by Application (2018-2023) & (USD Million)
Table 138. Europe Water Treatment Chemicals Consumption Value by Application (2024-2029) & (USD Million)
Table 139. Europe Water Treatment Chemicals Consumption Value by Country (2018-2023) & (USD Million)
Table 140. Europe Water Treatment Chemicals Consumption Value by Country (2024-2029) & (USD Million)
Table 141. Asia-Pacific Water Treatment Chemicals Consumption Value by Type (2018-2023) & (USD Million)
Table 142. Asia-Pacific Water Treatment Chemicals Consumption Value by Type (2024-2029) & (USD Million)
Table 143. Asia-Pacific Water Treatment Chemicals Consumption Value by Application (2018-2023) & (USD Million)
Table 144. Asia-Pacific Water Treatment Chemicals Consumption Value by Application (2024-2029) & (USD Million)
Table 145. Asia-Pacific Water Treatment Chemicals Consumption Value by Region (2018-2023) & (USD Million)
Table 146. Asia-Pacific Water Treatment Chemicals Consumption Value by Region (2024-2029) & (USD Million)
Table 147. South America Water Treatment Chemicals Consumption Value by Type (2018-2023) & (USD Million)
Table 148. South America Water Treatment Chemicals Consumption Value by Type (2024-2029) & (USD Million)
Table 149. South America Water Treatment Chemicals Consumption Value by Application (2018-2023) & (USD Million)
Table 150. South America Water Treatment Chemicals Consumption Value by Application (2024-2029) & (USD Million)
Table 151. South America Water Treatment Chemicals Consumption Value by Country (2018-2023) & (USD Million)
Table 152. South America Water Treatment Chemicals Consumption Value by Country (2024-2029) & (USD Million)
Table 153. Middle East & Africa Water Treatment Chemicals Consumption Value by Type (2018-2023) & (USD Million)
Table 154. Middle East & Africa Water Treatment Chemicals Consumption Value by Type (2024-2029) & (USD Million)
Table 155. Middle East & Africa Water Treatment Chemicals Consumption Value by Application (2018-2023) & (USD Million)
Table 156. Middle East & Africa Water Treatment Chemicals Consumption Value by Application (2024-2029) & (USD Million)
Table 157. Middle East & Africa Water Treatment Chemicals Consumption Value by Country (2018-2023) & (USD Million)
Table 158. Middle East & Africa Water Treatment Chemicals Consumption Value by Country (2024-2029) & (USD Million)
Table 159. Water Treatment Chemicals Raw Material
Table 160. Key Suppliers of Water Treatment Chemicals Raw Materials
List of Figures
Figure 1. Water Treatment Chemicals Picture
Figure 2. Global Water Treatment Chemicals Consumption Value by Type, (USD Million), 2018 & 2022 & 2029
Figure 3. Global Water Treatment Chemicals Consumption Value Market Share by Type in 2022
Figure 4. Ph Adjusters & Softeners
Figure 5. Flocculants & Coagulants
Figure 6. Corrosion Inhibitors
Figure 7. Scale Inhibitors/Dispersants
Figure 8. Biocides & Disinfectants
Figure 9. Others
Figure 10. Global Water Treatment Chemicals Consumption Value by Type, (USD Million), 2018 & 2022 & 2029
Figure 11. Water Treatment Chemicals Consumption Value Market Share by Application in 2022
Figure 12. Municipal Water Treatment Picture
Figure 13. Papermaking Waste Water Treatment Picture
Figure 14. Metal & Mining Industry Picture
Figure 15. Oil & Gas industry Picture
Figure 16. Others Picture
Figure 17. Global Water Treatment Chemicals Consumption Value, (USD Million): 2018 & 2022 & 2029
Figure 18. Global Water Treatment Chemicals Consumption Value and Forecast (2018-2029) & (USD Million)
Figure 19. Global Market Water Treatment Chemicals Consumption Value (USD Million) Comparison by Region (2018 & 2022 & 2029)
Figure 20. Global Water Treatment Chemicals Consumption Value Market Share by Region (2018-2029)
Figure 21. Global Water Treatment Chemicals Consumption Value Market Share by Region in 2022
Figure 22. North America Water Treatment Chemicals Consumption Value (2018-2029) & (USD Million)
Figure 23. Europe Water Treatment Chemicals Consumption Value (2018-2029) & (USD Million)
Figure 24. Asia-Pacific Water Treatment Chemicals Consumption Value (2018-2029) & (USD Million)
Figure 25. South America Water Treatment Chemicals Consumption Value (2018-2029) & (USD Million)
Figure 26. Middle East and Africa Water Treatment Chemicals Consumption Value (2018-2029) & (USD Million)
Figure 27. Global Water Treatment Chemicals Revenue Share by Players in 2022
Figure 28. Water Treatment Chemicals Market Share by Company Type (Tier 1, Tier 2 and Tier 3) in 2022
Figure 29. Global Top 3 Players Water Treatment Chemicals Market Share in 2022
Figure 30. Global Top 6 Players Water Treatment Chemicals Market Share in 2022
Figure 31. Global Water Treatment Chemicals Consumption Value Share by Type (2018-2023)
Figure 32. Global Water Treatment Chemicals Market Share Forecast by Type (2024-2029)
Figure 33. Global Water Treatment Chemicals Consumption Value Share by Application (2018-2023)
Figure 34. Global Water Treatment Chemicals Market Share Forecast by Application (2024-2029)
Figure 35. North America Water Treatment Chemicals Consumption Value Market Share by Type (2018-2029)
Figure 36. North America Water Treatment Chemicals Consumption Value Market Share by Application (2018-2029)
Figure 37. North America Water Treatment Chemicals Consumption Value Market Share by Country (2018-2029)
Figure 38. United States Water Treatment Chemicals Consumption Value (2018-2029) & (USD Million)
Figure 39. Canada Water Treatment Chemicals Consumption Value (2018-2029) & (USD Million)
Figure 40. Mexico Water Treatment Chemicals Consumption Value (2018-2029) & (USD Million)
Figure 41. Europe Water Treatment Chemicals Consumption Value Market Share by Type (2018-2029)
Figure 42. Europe Water Treatment Chemicals Consumption Value Market Share by Application (2018-2029)
Figure 43. Europe Water Treatment Chemicals Consumption Value Market Share by Country (2018-2029)
Figure 44. Germany Water Treatment Chemicals Consumption Value (2018-2029) & (USD Million)
Figure 45. France Water Treatment Chemicals Consumption Value (2018-2029) & (USD Million)
Figure 46. United Kingdom Water Treatment Chemicals Consumption Value (2018-2029) & (USD Million)
Figure 47. Russia Water Treatment Chemicals Consumption Value (2018-2029) & (USD Million)
Figure 48. Italy Water Treatment Chemicals Consumption Value (2018-2029) & (USD Million)
Figure 49. Asia-Pacific Water Treatment Chemicals Consumption Value Market Share by Type (2018-2029)
Figure 50. Asia-Pacific Water Treatment Chemicals Consumption Value Market Share by Application (2018-2029)
Figure 51. Asia-Pacific Water Treatment Chemicals Consumption Value Market Share by Region (2018-2029)
Figure 52. China Water Treatment Chemicals Consumption Value (2018-2029) & (USD Million)
Figure 53. Japan Water Treatment Chemicals Consumption Value (2018-2029) & (USD Million)
Figure 54. South Korea Water Treatment Chemicals Consumption Value (2018-2029) & (USD Million)
Figure 55. India Water Treatment Chemicals Consumption Value (2018-2029) & (USD Million)
Figure 56. Southeast Asia Water Treatment Chemicals Consumption Value (2018-2029) & (USD Million)
Figure 57. Australia Water Treatment Chemicals Consumption Value (2018-2029) & (USD Million)
Figure 58. South America Water Treatment Chemicals Consumption Value Market Share by Type (2018-2029)
Figure 59. South America Water Treatment Chemicals Consumption Value Market Share by Application (2018-2029)
Figure 60. South America Water Treatment Chemicals Consumption Value Market Share by Country (2018-2029)
Figure 61. Brazil Water Treatment Chemicals Consumption Value (2018-2029) & (USD Million)
Figure 62. Argentina Water Treatment Chemicals Consumption Value (2018-2029) & (USD Million)
Figure 63. Middle East and Africa Water Treatment Chemicals Consumption Value Market Share by Type (2018-2029)
Figure 64. Middle East and Africa Water Treatment Chemicals Consumption Value Market Share by Application (2018-2029)
Figure 65. Middle East and Africa Water Treatment Chemicals Consumption Value Market Share by Country (2018-2029)
Figure 66. Turkey Water Treatment Chemicals Consumption Value (2018-2029) & (USD Million)
Figure 67. Saudi Arabia Water Treatment Chemicals Consumption Value (2018-2029) & (USD Million)
Figure 68. UAE Water Treatment Chemicals Consumption Value (2018-2029) & (USD Million)
Figure 69. Water Treatment Chemicals Market Drivers
Figure 70. Water Treatment Chemicals Market Restraints
Figure 71. Water Treatment Chemicals Market Trends
Figure 72. Porters Five Forces Analysis
Figure 73. Manufacturing Cost Structure Analysis of Water Treatment Chemicals in 2022
Figure 74. Manufacturing Process Analysis of Water Treatment Chemicals
Figure 75. Water Treatment Chemicals Industrial Chain
Figure 76. Methodology
Figure 77. Research Process and Data Source