Market Outlook
The global Upcycled Cosmetic Ingredients Market size was valued at USD 308.7 million in 2022 and is forecast to a readjusted size of USD 456.3 million by 2029 with a CAGR of 5.7% during review period.
Introduction: Why the Upcycled Cosmetic Ingredients Market Matters in 2025
The Upcycled Cosmetic Ingredients Market is expanding rapidly in 2025 as beauty brands respond to sustainability demands and circular economy principles. These ingredients - derived from food, agricultural, or industrial by-products - offer an eco-conscious alternative without compromising performance, making them highly appealing to both formulators and conscious consumers.
Market Drivers: What’s Fueling the Upcycled Cosmetic Ingredients Market Boom?
Consumer Shift Toward Clean Beauty: Increasing demand for sustainable, ethically sourced, and transparent beauty products.
Food Waste Mitigation Initiatives: Global efforts to reduce waste encourage brands to repurpose by-products from coffee, fruit peels, or wine grapes.
Regulatory and Retailer Pressure: Retailers and certifying bodies are favoring suppliers with environmental and ethical sourcing credentials.
Innovation in Focus: How Manufacturers Are Raising the Bar
Green Extraction Technologies: Using low-energy, solvent-free methods to maintain ingredient potency and purity.
Active Compound Optimization: Enhancing bioavailability and functionality of upcycled ingredients for skincare, haircare, and color cosmetics.
Brand Partnerships: Collaborations between food and cosmetic sectors to secure supply chains of premium by-products.
Regional Breakdown: Where the Market is Growing Fastest
Europe: Leading with a strong eco-certification culture and consumer preference for sustainable cosmetics.
North America: Rapid adoption driven by indie beauty brands and green formulation trends.
Asia-Pacific: Growth fueled by rising beauty markets in South Korea, Japan, and Australia with increasing sustainability focus.
Strategic Considerations: How to Succeed in the Upcycled Cosmetic Ingredients Market 2025
Transparency is Key: Ensure full traceability and clear communication around sourcing and processing.
Certify and Validate: Third-party certification (e.g., COSMOS, Ecocert) boosts credibility with both formulators and consumers.
Educate the Market: Offer data-driven marketing and science-backed claims to explain benefits of upcycled ingredients.
Conclusion: The Upcycled Cosmetic Ingredients Market 2025 - Where Sustainability Meets Innovation
As clean beauty evolves into climate-positive beauty, upcycled ingredients will become a mainstream expectation. Brands that align performance with environmental impact will dominate this emerging, values-driven market segment.
Key Market Players
- SOPHIM
- Cargill
- Incorporated
- RAHN AG
- P2 Science, Inc.
- Mibelle AG
- Hair O'rightInternational Corporation
- OLVEA Group
- Givaudan SA
- Lignopure GmbH
- Symrise
Segmentation By Type
- Liquid
- Powder
- Others
Segmentation By Application
- Skin Care
- Hair Care
- Color Cosmetics
- Others
Segmentation By Region
- North America (United States, Canada and Mexico)
- Europe (Germany, France, United Kingdom, Russia, Italy, and Rest of Europe)
- Asia-Pacific (China, Japan, Korea, India, Southeast Asia, and Australia)
- South America (Brazil, Argentina, Colombia, and Rest of South America)
- Middle East & Africa (Saudi Arabia, UAE, Egypt, South Africa, and Rest of Middle East & Africa)
Market SWOT Analysis
What are the strengths of the Upcycled Cosmetic Ingredients Market in 2025?
The upcycled cosmetic ingredients market is gaining traction as consumers increasingly demand sustainable and eco-friendly products. Upcycled ingredients provide a way to reduce waste by reusing materials that would otherwise be discarded. These ingredients are also often seen as innovative and natural, catering to the growing trend of clean beauty, which is driving the market.
What are the weaknesses of the Upcycled Cosmetic Ingredients Market in 2025?
A weakness of the upcycled cosmetic ingredients market is the limited consumer awareness of upcycled products, which may hinder growth. Additionally, sourcing and processing upcycled ingredients can sometimes involve complex logistics and higher costs, affecting the price competitiveness. The stigma that upcycled products are of inferior quality compared to traditional ingredients could also pose challenges.
What are the opportunities for the Upcycled Cosmetic Ingredients Market in 2025?
The increasing global demand for sustainable and ethically produced cosmetic products presents a significant opportunity for upcycled ingredients. As the beauty industry moves toward reducing its environmental footprint, upcycled ingredients provide an avenue for brands to offer eco-friendly alternatives. There are also opportunities for innovation in upcycling methods, making products more appealing to consumers looking for unique, natural solutions.
What are the threats to the Upcycled Cosmetic Ingredients Market in 2025?
The market faces threats from the higher cost and limited scalability of upcycled ingredient production. Furthermore, competition from other sustainable materials and ingredients could limit the market share for upcycled cosmetics. Consumer skepticism regarding the efficacy and safety of upcycled ingredients may also hinder their acceptance.
Market PESTEL Analysis
How do political factors impact the Upcycled Cosmetic Ingredients Market in 2025?
Government policies on waste reduction and circular economy initiatives encourage the use of upcycled ingredients. Regulations on cosmetic safety influence product formulations.
What economic factors affect the Upcycled Cosmetic Ingredients Market in 2025?
The rising demand for sustainable beauty products drives market growth. Cost efficiency from repurposed raw materials makes upcycled ingredients attractive to manufacturers.
How do social factors shape the Upcycled Cosmetic Ingredients Market in 2025?
Consumers prioritize eco-friendly and cruelty-free beauty products, supporting the adoption of upcycled ingredients. Ethical sourcing and transparency trends influence purchasing decisions.
What technological factors are relevant to the Upcycled Cosmetic Ingredients Market in 2025?
Innovations in extraction and purification processes enhance ingredient quality. Advances in biotechnology improve the efficacy of upcycled components in skincare and haircare products.
What environmental factors influence the Upcycled Cosmetic Ingredients Market in 2025?
Sustainability efforts drive the use of food and agricultural byproducts in cosmetics. Regulations on reducing cosmetic waste and carbon footprint impact ingredient sourcing.
How do legal factors impact the Upcycled Cosmetic Ingredients Market in 2025?
Compliance with FDA, EU Cosmetics Regulation, and organic certification requirements affects market entry. Labeling laws mandate clear claims about sustainability and ingredient origins.
Market SIPOC Analysis
Who are the suppliers in the Upcycled Cosmetic Ingredients Market in 2025?
Suppliers include food and agricultural byproduct processors, cosmetic raw material distributors, and sustainable ingredient formulators. Extraction and purification equipment suppliers also contribute.
What are the inputs in the Upcycled Cosmetic Ingredients Market in 2025?
Inputs include waste-derived botanical extracts, essential oils, bioactive compounds, and plant-based emulsifiers. Regulatory approvals for cosmetic safety and sustainability certifications are critical.
What processes are involved in the Upcycled Cosmetic Ingredients Market in 2025?
Processes involve extraction, refining, stabilization, and formulation into skincare, haircare, and personal care products. Testing ensures efficacy, safety, and stability.
Who are the customers in the Upcycled Cosmetic Ingredients Market in 2025?
Customers include cosmetic brands, personal care formulators, and natural beauty product manufacturers. Eco-conscious consumers and clean beauty advocates drive demand.
What are the outcomes in the Upcycled Cosmetic Ingredients Market in 2025?
Outcomes include reduced waste in the cosmetics industry, increased demand for sustainable formulations, and enhanced consumer awareness of circular economy beauty products.
Market Porter's Five Forces
What is the threat of new entrants in the Upcycled Cosmetic Ingredients Market in 2025?
The threat of new entrants is moderate. The growing demand for sustainable and clean beauty formulations creates opportunities, but new players must overcome regulatory approvals and sourcing challenges.
What is the bargaining power of suppliers in the Upcycled Cosmetic Ingredients Market in 2025?
The bargaining power of suppliers is moderate. Raw materials come from food and agricultural waste, and ingredient processors depend on consistent waste streams from industries like food and beverage.
What is the bargaining power of buyers in the Upcycled Cosmetic Ingredients Market in 2025?
The bargaining power of buyers is high. Cosmetic brands seek sustainable and natural alternatives, pressuring suppliers to provide high-quality, cost-effective, and certified organic ingredients.
What is the threat of substitute products in the Upcycled Cosmetic Ingredients Market in 2025?
The threat of substitutes is moderate. Traditional plant-based and synthetic cosmetic ingredients remain available, but the shift toward eco-conscious beauty products favors upcycled alternatives.
What is the intensity of competitive rivalry in the Upcycled Cosmetic Ingredients Market in 2025?
The intensity of competitive rivalry is high. Companies compete on sustainability claims, ingredient purity, and innovation in bioactive properties to differentiate their products.
Market Upstream Analysis
What are the key raw materials in the Upcycled Cosmetic Ingredients Market in 2025?
The key raw materials include fruit and vegetable byproducts, plant-based oils, coffee grounds, and botanical extracts repurposed from food and agriculture waste.
What role do suppliers play in the Upcycled Cosmetic Ingredients Market in 2025?
Suppliers collect, process, and refine food waste into active ingredients for skincare, haircare, and personal care formulations. They ensure consistency in extraction quality and safety.
How does the regulatory environment affect upstream factors in this market?
Cosmetic safety regulations, organic certification requirements, and sustainability mandates influence ingredient sourcing and processing methods. Compliance with EU and FDA clean beauty standards is critical.
What technological advancements influence upstream production in the Upcycled Cosmetic Ingredients Market in 2025?
Advanced cold-press extraction and enzyme-assisted processing improve nutrient retention and bioavailability. Microencapsulation enhances ingredient stability in formulations.
What challenges do upstream suppliers face in this market?
Sourcing consistent-quality waste streams, ensuring long-term stability of repurposed ingredients, and competition from conventional synthetic alternatives pose challenges.
Market Midstream Analysis
What are the key processes involved in the midstream of the Upcycled Cosmetic Ingredients Market in 2025?
The key processes include collection of food byproducts, extraction of active compounds, purification, and formulation into cosmetic-grade ingredients.
How do manufacturers contribute to the Upcycled Cosmetic Ingredients Market in 2025?
Manufacturers refine extraction processes to maximize yield and bioavailability. They also ensure safety testing and compliance with cosmetic industry standards.
What is the role of packaging in the midstream of this market?
Ingredients are packaged in airtight, UV-protected containers to maintain potency and stability during transport.
What challenges do companies face in the midstream of this market?
Variability in raw material quality, supply chain logistics for food waste collection, and regulatory approval for new cosmetic ingredients create challenges.
How do distribution channels affect the Upcycled Cosmetic Ingredients Market in 2025?
Ingredients are distributed through cosmetic raw material suppliers, direct agreements with skincare brands, and sustainability-focused ingredient platforms.
Market Downstream Analysis
What are the key consumer segments in the Upcycled Cosmetic Ingredients Market in 2025?
Key consumer segments include organic skincare brands, clean beauty companies, and sustainable personal care product manufacturers.
How do retailers and online platforms contribute to the Upcycled Cosmetic Ingredients Market in 2025?
Retailers supply these ingredients through specialty cosmetic raw material suppliers, while online platforms allow direct ordering of sustainably sourced ingredients by beauty brands.
What role does consumer education play in the downstream market for Upcycled Cosmetic Ingredients in 2025?
Education is crucial in promoting the environmental benefits of upcycled ingredients, their efficacy in skincare formulations, and their role in reducing cosmetic waste.
What challenges do companies face in the downstream market of this industry?
Challenges include consumer skepticism about efficacy, limited scalability of upcycled ingredient production, and regulatory hurdles for cosmetic safety approvals.
How does consumer feedback influence the Upcycled Cosmetic Ingredients Market in 2025?
Positive feedback on sustainability and ingredient performance encourages brands to expand their use of upcycled materials and improve marketing transparency.
Chapter 1, to describe Upcycled Cosmetic Ingredients product scope, market overview, market estimation caveats and base year.
Chapter 2, to profile the top manufacturers of Upcycled Cosmetic Ingredients, with price, sales, revenue and global market share of Upcycled Cosmetic Ingredients from 2018 to 2023.
Chapter 3, the Upcycled Cosmetic Ingredients competitive situation, sales quantity, revenue and global market share of top manufacturers are analyzed emphatically by landscape contrast.
Chapter 4, the Upcycled Cosmetic Ingredients breakdown data are shown at the regional level, to show the sales quantity, consumption value and growth by regions, from 2018 to 2029.
Chapter 5 and 6, to segment the sales by Type and application, with sales market share and growth rate by type, application, from 2018 to 2029.
Chapter 7, 8, 9, 10 and 11, to break the sales data at the country level, with sales quantity, consumption value and market share for key countries in the world, from 2017 to 2022.and Upcycled Cosmetic Ingredients market forecast, by regions, type and application, with sales and revenue, from 2024 to 2029.
Chapter 12, market dynamics, drivers, restraints, trends, Porters Five Forces analysis, and Influence of COVID-19 and Russia-Ukraine War.
Chapter 13, the key raw materials and key suppliers, and industry chain of Upcycled Cosmetic Ingredients.
Chapter 14 and 15, to describe Upcycled Cosmetic Ingredients sales channel, distributors, customers, research findings and conclusion.
1 Market Overview
1.1 Product Overview and Scope of Upcycled Cosmetic Ingredients
1.2 Market Estimation Caveats and Base Year
1.3 Market Analysis by Type
1.3.1 Overview: Global Upcycled Cosmetic Ingredients Consumption Value by Type: 2018 Versus 2022 Versus 2029
1.3.2 Liquid
1.3.3 Powder
1.3.4 Others
1.4 Market Analysis by Application
1.4.1 Overview: Global Upcycled Cosmetic Ingredients Consumption Value by Application: 2018 Versus 2022 Versus 2029
1.4.2 Skin Care
1.4.3 Hair Care
1.4.4 Color Cosmetics
1.4.5 Others
1.5 Global Upcycled Cosmetic Ingredients Market Size & Forecast
1.5.1 Global Upcycled Cosmetic Ingredients Consumption Value (2018 & 2022 & 2029)
1.5.2 Global Upcycled Cosmetic Ingredients Sales Quantity (2018-2029)
1.5.3 Global Upcycled Cosmetic Ingredients Average Price (2018-2029)
2 Manufacturers Profiles
2.1 SOPHIM
2.1.1 SOPHIM Details
2.1.2 SOPHIM Major Business
2.1.3 SOPHIM Upcycled Cosmetic Ingredients Product and Services
2.1.4 SOPHIM Upcycled Cosmetic Ingredients Sales Quantity, Average Price, Revenue, Gross Margin and Market Share (2018-2023)
2.1.5 SOPHIM Recent Developments/Updates
2.2 Cargill
2.2.1 Cargill Details
2.2.2 Cargill Major Business
2.2.3 Cargill Upcycled Cosmetic Ingredients Product and Services
2.2.4 Cargill Upcycled Cosmetic Ingredients Sales Quantity, Average Price, Revenue, Gross Margin and Market Share (2018-2023)
2.2.5 Cargill Recent Developments/Updates
2.3 Incorporated
2.3.1 Incorporated Details
2.3.2 Incorporated Major Business
2.3.3 Incorporated Upcycled Cosmetic Ingredients Product and Services
2.3.4 Incorporated Upcycled Cosmetic Ingredients Sales Quantity, Average Price, Revenue, Gross Margin and Market Share (2018-2023)
2.3.5 Incorporated Recent Developments/Updates
2.4 RAHN AG
2.4.1 RAHN AG Details
2.4.2 RAHN AG Major Business
2.4.3 RAHN AG Upcycled Cosmetic Ingredients Product and Services
2.4.4 RAHN AG Upcycled Cosmetic Ingredients Sales Quantity, Average Price, Revenue, Gross Margin and Market Share (2018-2023)
2.4.5 RAHN AG Recent Developments/Updates
2.5 P2 Science, Inc.
2.5.1 P2 Science, Inc. Details
2.5.2 P2 Science, Inc. Major Business
2.5.3 P2 Science, Inc. Upcycled Cosmetic Ingredients Product and Services
2.5.4 P2 Science, Inc. Upcycled Cosmetic Ingredients Sales Quantity, Average Price, Revenue, Gross Margin and Market Share (2018-2023)
2.5.5 P2 Science, Inc. Recent Developments/Updates
2.6 Mibelle AG
2.6.1 Mibelle AG Details
2.6.2 Mibelle AG Major Business
2.6.3 Mibelle AG Upcycled Cosmetic Ingredients Product and Services
2.6.4 Mibelle AG Upcycled Cosmetic Ingredients Sales Quantity, Average Price, Revenue, Gross Margin and Market Share (2018-2023)
2.6.5 Mibelle AG Recent Developments/Updates
2.7 Hair O'rightInternational Corporation
2.7.1 Hair O'rightInternational Corporation Details
2.7.2 Hair O'rightInternational Corporation Major Business
2.7.3 Hair O'rightInternational Corporation Upcycled Cosmetic Ingredients Product and Services
2.7.4 Hair O'rightInternational Corporation Upcycled Cosmetic Ingredients Sales Quantity, Average Price, Revenue, Gross Margin and Market Share (2018-2023)
2.7.5 Hair O'rightInternational Corporation Recent Developments/Updates
2.8 OLVEA Group
2.8.1 OLVEA Group Details
2.8.2 OLVEA Group Major Business
2.8.3 OLVEA Group Upcycled Cosmetic Ingredients Product and Services
2.8.4 OLVEA Group Upcycled Cosmetic Ingredients Sales Quantity, Average Price, Revenue, Gross Margin and Market Share (2018-2023)
2.8.5 OLVEA Group Recent Developments/Updates
2.9 Givaudan SA
2.9.1 Givaudan SA Details
2.9.2 Givaudan SA Major Business
2.9.3 Givaudan SA Upcycled Cosmetic Ingredients Product and Services
2.9.4 Givaudan SA Upcycled Cosmetic Ingredients Sales Quantity, Average Price, Revenue, Gross Margin and Market Share (2018-2023)
2.9.5 Givaudan SA Recent Developments/Updates
2.10 Lignopure GmbH
2.10.1 Lignopure GmbH Details
2.10.2 Lignopure GmbH Major Business
2.10.3 Lignopure GmbH Upcycled Cosmetic Ingredients Product and Services
2.10.4 Lignopure GmbH Upcycled Cosmetic Ingredients Sales Quantity, Average Price, Revenue, Gross Margin and Market Share (2018-2023)
2.10.5 Lignopure GmbH Recent Developments/Updates
2.11 Symrise
2.11.1 Symrise Details
2.11.2 Symrise Major Business
2.11.3 Symrise Upcycled Cosmetic Ingredients Product and Services
2.11.4 Symrise Upcycled Cosmetic Ingredients Sales Quantity, Average Price, Revenue, Gross Margin and Market Share (2018-2023)
2.11.5 Symrise Recent Developments/Updates
3 Competitive Environment: Upcycled Cosmetic Ingredients by Manufacturer
3.1 Global Upcycled Cosmetic Ingredients Sales Quantity by Manufacturer (2018-2023)
3.2 Global Upcycled Cosmetic Ingredients Revenue by Manufacturer (2018-2023)
3.3 Global Upcycled Cosmetic Ingredients Average Price by Manufacturer (2018-2023)
3.4 Market Share Analysis (2022)
3.4.1 Producer Shipments of Upcycled Cosmetic Ingredients by Manufacturer Revenue ($MM) and Market Share (%): 2022
3.4.2 Top 3 Upcycled Cosmetic Ingredients Manufacturer Market Share in 2022
3.4.2 Top 6 Upcycled Cosmetic Ingredients Manufacturer Market Share in 2022
3.5 Upcycled Cosmetic Ingredients Market: Overall Company Footprint Analysis
3.5.1 Upcycled Cosmetic Ingredients Market: Region Footprint
3.5.2 Upcycled Cosmetic Ingredients Market: Company Product Type Footprint
3.5.3 Upcycled Cosmetic Ingredients Market: Company Product Application Footprint
3.6 New Market Entrants and Barriers to Market Entry
3.7 Mergers, Acquisition, Agreements, and Collaborations
4 Consumption Analysis by Region
4.1 Global Upcycled Cosmetic Ingredients Market Size by Region
4.1.1 Global Upcycled Cosmetic Ingredients Sales Quantity by Region (2018-2029)
4.1.2 Global Upcycled Cosmetic Ingredients Consumption Value by Region (2018-2029)
4.1.3 Global Upcycled Cosmetic Ingredients Average Price by Region (2018-2029)
4.2 North America Upcycled Cosmetic Ingredients Consumption Value (2018-2029)
4.3 Europe Upcycled Cosmetic Ingredients Consumption Value (2018-2029)
4.4 Asia-Pacific Upcycled Cosmetic Ingredients Consumption Value (2018-2029)
4.5 South America Upcycled Cosmetic Ingredients Consumption Value (2018-2029)
4.6 Middle East and Africa Upcycled Cosmetic Ingredients Consumption Value (2018-2029)
5 Market Segment by Type
5.1 Global Upcycled Cosmetic Ingredients Sales Quantity by Type (2018-2029)
5.2 Global Upcycled Cosmetic Ingredients Consumption Value by Type (2018-2029)
5.3 Global Upcycled Cosmetic Ingredients Average Price by Type (2018-2029)
6 Market Segment by Application
6.1 Global Upcycled Cosmetic Ingredients Sales Quantity by Application (2018-2029)
6.2 Global Upcycled Cosmetic Ingredients Consumption Value by Application (2018-2029)
6.3 Global Upcycled Cosmetic Ingredients Average Price by Application (2018-2029)
7 North America
7.1 North America Upcycled Cosmetic Ingredients Sales Quantity by Type (2018-2029)
7.2 North America Upcycled Cosmetic Ingredients Sales Quantity by Application (2018-2029)
7.3 North America Upcycled Cosmetic Ingredients Market Size by Country
7.3.1 North America Upcycled Cosmetic Ingredients Sales Quantity by Country (2018-2029)
7.3.2 North America Upcycled Cosmetic Ingredients Consumption Value by Country (2018-2029)
7.3.3 United States Market Size and Forecast (2018-2029)
7.3.4 Canada Market Size and Forecast (2018-2029)
7.3.5 Mexico Market Size and Forecast (2018-2029)
8 Europe
8.1 Europe Upcycled Cosmetic Ingredients Sales Quantity by Type (2018-2029)
8.2 Europe Upcycled Cosmetic Ingredients Sales Quantity by Application (2018-2029)
8.3 Europe Upcycled Cosmetic Ingredients Market Size by Country
8.3.1 Europe Upcycled Cosmetic Ingredients Sales Quantity by Country (2018-2029)
8.3.2 Europe Upcycled Cosmetic Ingredients Consumption Value by Country (2018-2029)
8.3.3 Germany Market Size and Forecast (2018-2029)
8.3.4 France Market Size and Forecast (2018-2029)
8.3.5 United Kingdom Market Size and Forecast (2018-2029)
8.3.6 Russia Market Size and Forecast (2018-2029)
8.3.7 Italy Market Size and Forecast (2018-2029)
9 Asia-Pacific
9.1 Asia-Pacific Upcycled Cosmetic Ingredients Sales Quantity by Type (2018-2029)
9.2 Asia-Pacific Upcycled Cosmetic Ingredients Sales Quantity by Application (2018-2029)
9.3 Asia-Pacific Upcycled Cosmetic Ingredients Market Size by Region
9.3.1 Asia-Pacific Upcycled Cosmetic Ingredients Sales Quantity by Region (2018-2029)
9.3.2 Asia-Pacific Upcycled Cosmetic Ingredients Consumption Value by Region (2018-2029)
9.3.3 China Market Size and Forecast (2018-2029)
9.3.4 Japan Market Size and Forecast (2018-2029)
9.3.5 Korea Market Size and Forecast (2018-2029)
9.3.6 India Market Size and Forecast (2018-2029)
9.3.7 Southeast Asia Market Size and Forecast (2018-2029)
9.3.8 Australia Market Size and Forecast (2018-2029)
10 South America
10.1 South America Upcycled Cosmetic Ingredients Sales Quantity by Type (2018-2029)
10.2 South America Upcycled Cosmetic Ingredients Sales Quantity by Application (2018-2029)
10.3 South America Upcycled Cosmetic Ingredients Market Size by Country
10.3.1 South America Upcycled Cosmetic Ingredients Sales Quantity by Country (2018-2029)
10.3.2 South America Upcycled Cosmetic Ingredients Consumption Value by Country (2018-2029)
10.3.3 Brazil Market Size and Forecast (2018-2029)
10.3.4 Argentina Market Size and Forecast (2018-2029)
11 Middle East & Africa
11.1 Middle East & Africa Upcycled Cosmetic Ingredients Sales Quantity by Type (2018-2029)
11.2 Middle East & Africa Upcycled Cosmetic Ingredients Sales Quantity by Application (2018-2029)
11.3 Middle East & Africa Upcycled Cosmetic Ingredients Market Size by Country
11.3.1 Middle East & Africa Upcycled Cosmetic Ingredients Sales Quantity by Country (2018-2029)
11.3.2 Middle East & Africa Upcycled Cosmetic Ingredients Consumption Value by Country (2018-2029)
11.3.3 Turkey Market Size and Forecast (2018-2029)
11.3.4 Egypt Market Size and Forecast (2018-2029)
11.3.5 Saudi Arabia Market Size and Forecast (2018-2029)
11.3.6 South Africa Market Size and Forecast (2018-2029)
12 Market Dynamics
12.1 Upcycled Cosmetic Ingredients Market Drivers
12.2 Upcycled Cosmetic Ingredients Market Restraints
12.3 Upcycled Cosmetic Ingredients Trends Analysis
12.4 Porters Five Forces Analysis
12.4.1 Threat of New Entrants
12.4.2 Bargaining Power of Suppliers
12.4.3 Bargaining Power of Buyers
12.4.4 Threat of Substitutes
12.4.5 Competitive Rivalry
12.5 Influence of COVID-19 and Russia-Ukraine War
12.5.1 Influence of COVID-19
12.5.2 Influence of Russia-Ukraine War
13 Raw Material and Industry Chain
13.1 Raw Material of Upcycled Cosmetic Ingredients and Key Manufacturers
13.2 Manufacturing Costs Percentage of Upcycled Cosmetic Ingredients
13.3 Upcycled Cosmetic Ingredients Production Process
13.4 Upcycled Cosmetic Ingredients Industrial Chain
14 Shipments by Distribution Channel
14.1 Sales Channel
14.1.1 Direct to End-User
14.1.2 Distributors
14.2 Upcycled Cosmetic Ingredients Typical Distributors
14.3 Upcycled Cosmetic Ingredients Typical Customers
15 Research Findings and Conclusion
16 Appendix
16.1 Methodology
16.2 Research Process and Data Source
16.3 Disclaimer
List of Tables
Table 1. Global Upcycled Cosmetic Ingredients Consumption Value by Type, (USD Million), 2018 & 2022 & 2029
Table 2. Global Upcycled Cosmetic Ingredients Consumption Value by Application, (USD Million), 2018 & 2022 & 2029
Table 3. SOPHIM Basic Information, Manufacturing Base and Competitors
Table 4. SOPHIM Major Business
Table 5. SOPHIM Upcycled Cosmetic Ingredients Product and Services
Table 6. SOPHIM Upcycled Cosmetic Ingredients Sales Quantity (Tons), Average Price (US$/Ton), Revenue (USD Million), Gross Margin and Market Share (2018-2023)
Table 7. SOPHIM Recent Developments/Updates
Table 8. Cargill Basic Information, Manufacturing Base and Competitors
Table 9. Cargill Major Business
Table 10. Cargill Upcycled Cosmetic Ingredients Product and Services
Table 11. Cargill Upcycled Cosmetic Ingredients Sales Quantity (Tons), Average Price (US$/Ton), Revenue (USD Million), Gross Margin and Market Share (2018-2023)
Table 12. Cargill Recent Developments/Updates
Table 13. Incorporated Basic Information, Manufacturing Base and Competitors
Table 14. Incorporated Major Business
Table 15. Incorporated Upcycled Cosmetic Ingredients Product and Services
Table 16. Incorporated Upcycled Cosmetic Ingredients Sales Quantity (Tons), Average Price (US$/Ton), Revenue (USD Million), Gross Margin and Market Share (2018-2023)
Table 17. Incorporated Recent Developments/Updates
Table 18. RAHN AG Basic Information, Manufacturing Base and Competitors
Table 19. RAHN AG Major Business
Table 20. RAHN AG Upcycled Cosmetic Ingredients Product and Services
Table 21. RAHN AG Upcycled Cosmetic Ingredients Sales Quantity (Tons), Average Price (US$/Ton), Revenue (USD Million), Gross Margin and Market Share (2018-2023)
Table 22. RAHN AG Recent Developments/Updates
Table 23. P2 Science, Inc. Basic Information, Manufacturing Base and Competitors
Table 24. P2 Science, Inc. Major Business
Table 25. P2 Science, Inc. Upcycled Cosmetic Ingredients Product and Services
Table 26. P2 Science, Inc. Upcycled Cosmetic Ingredients Sales Quantity (Tons), Average Price (US$/Ton), Revenue (USD Million), Gross Margin and Market Share (2018-2023)
Table 27. P2 Science, Inc. Recent Developments/Updates
Table 28. Mibelle AG Basic Information, Manufacturing Base and Competitors
Table 29. Mibelle AG Major Business
Table 30. Mibelle AG Upcycled Cosmetic Ingredients Product and Services
Table 31. Mibelle AG Upcycled Cosmetic Ingredients Sales Quantity (Tons), Average Price (US$/Ton), Revenue (USD Million), Gross Margin and Market Share (2018-2023)
Table 32. Mibelle AG Recent Developments/Updates
Table 33. Hair O'rightInternational Corporation Basic Information, Manufacturing Base and Competitors
Table 34. Hair O'rightInternational Corporation Major Business
Table 35. Hair O'rightInternational Corporation Upcycled Cosmetic Ingredients Product and Services
Table 36. Hair O'rightInternational Corporation Upcycled Cosmetic Ingredients Sales Quantity (Tons), Average Price (US$/Ton), Revenue (USD Million), Gross Margin and Market Share (2018-2023)
Table 37. Hair O'rightInternational Corporation Recent Developments/Updates
Table 38. OLVEA Group Basic Information, Manufacturing Base and Competitors
Table 39. OLVEA Group Major Business
Table 40. OLVEA Group Upcycled Cosmetic Ingredients Product and Services
Table 41. OLVEA Group Upcycled Cosmetic Ingredients Sales Quantity (Tons), Average Price (US$/Ton), Revenue (USD Million), Gross Margin and Market Share (2018-2023)
Table 42. OLVEA Group Recent Developments/Updates
Table 43. Givaudan SA Basic Information, Manufacturing Base and Competitors
Table 44. Givaudan SA Major Business
Table 45. Givaudan SA Upcycled Cosmetic Ingredients Product and Services
Table 46. Givaudan SA Upcycled Cosmetic Ingredients Sales Quantity (Tons), Average Price (US$/Ton), Revenue (USD Million), Gross Margin and Market Share (2018-2023)
Table 47. Givaudan SA Recent Developments/Updates
Table 48. Lignopure GmbH Basic Information, Manufacturing Base and Competitors
Table 49. Lignopure GmbH Major Business
Table 50. Lignopure GmbH Upcycled Cosmetic Ingredients Product and Services
Table 51. Lignopure GmbH Upcycled Cosmetic Ingredients Sales Quantity (Tons), Average Price (US$/Ton), Revenue (USD Million), Gross Margin and Market Share (2018-2023)
Table 52. Lignopure GmbH Recent Developments/Updates
Table 53. Symrise Basic Information, Manufacturing Base and Competitors
Table 54. Symrise Major Business
Table 55. Symrise Upcycled Cosmetic Ingredients Product and Services
Table 56. Symrise Upcycled Cosmetic Ingredients Sales Quantity (Tons), Average Price (US$/Ton), Revenue (USD Million), Gross Margin and Market Share (2018-2023)
Table 57. Symrise Recent Developments/Updates
Table 58. Global Upcycled Cosmetic Ingredients Sales Quantity by Manufacturer (2018-2023) & (Tons)
Table 59. Global Upcycled Cosmetic Ingredients Revenue by Manufacturer (2018-2023) & (USD Million)
Table 60. Global Upcycled Cosmetic Ingredients Average Price by Manufacturer (2018-2023) & (US$/Ton)
Table 61. Market Position of Manufacturers in Upcycled Cosmetic Ingredients, (Tier 1, Tier 2, and Tier 3), Based on Consumption Value in 2022
Table 62. Head Office and Upcycled Cosmetic Ingredients Production Site of Key Manufacturer
Table 63. Upcycled Cosmetic Ingredients Market: Company Product Type Footprint
Table 64. Upcycled Cosmetic Ingredients Market: Company Product Application Footprint
Table 65. Upcycled Cosmetic Ingredients New Market Entrants and Barriers to Market Entry
Table 66. Upcycled Cosmetic Ingredients Mergers, Acquisition, Agreements, and Collaborations
Table 67. Global Upcycled Cosmetic Ingredients Sales Quantity by Region (2018-2023) & (Tons)
Table 68. Global Upcycled Cosmetic Ingredients Sales Quantity by Region (2024-2029) & (Tons)
Table 69. Global Upcycled Cosmetic Ingredients Consumption Value by Region (2018-2023) & (USD Million)
Table 70. Global Upcycled Cosmetic Ingredients Consumption Value by Region (2024-2029) & (USD Million)
Table 71. Global Upcycled Cosmetic Ingredients Average Price by Region (2018-2023) & (US$/Ton)
Table 72. Global Upcycled Cosmetic Ingredients Average Price by Region (2024-2029) & (US$/Ton)
Table 73. Global Upcycled Cosmetic Ingredients Sales Quantity by Type (2018-2023) & (Tons)
Table 74. Global Upcycled Cosmetic Ingredients Sales Quantity by Type (2024-2029) & (Tons)
Table 75. Global Upcycled Cosmetic Ingredients Consumption Value by Type (2018-2023) & (USD Million)
Table 76. Global Upcycled Cosmetic Ingredients Consumption Value by Type (2024-2029) & (USD Million)
Table 77. Global Upcycled Cosmetic Ingredients Average Price by Type (2018-2023) & (US$/Ton)
Table 78. Global Upcycled Cosmetic Ingredients Average Price by Type (2024-2029) & (US$/Ton)
Table 79. Global Upcycled Cosmetic Ingredients Sales Quantity by Application (2018-2023) & (Tons)
Table 80. Global Upcycled Cosmetic Ingredients Sales Quantity by Application (2024-2029) & (Tons)
Table 81. Global Upcycled Cosmetic Ingredients Consumption Value by Application (2018-2023) & (USD Million)
Table 82. Global Upcycled Cosmetic Ingredients Consumption Value by Application (2024-2029) & (USD Million)
Table 83. Global Upcycled Cosmetic Ingredients Average Price by Application (2018-2023) & (US$/Ton)
Table 84. Global Upcycled Cosmetic Ingredients Average Price by Application (2024-2029) & (US$/Ton)
Table 85. North America Upcycled Cosmetic Ingredients Sales Quantity by Type (2018-2023) & (Tons)
Table 86. North America Upcycled Cosmetic Ingredients Sales Quantity by Type (2024-2029) & (Tons)
Table 87. North America Upcycled Cosmetic Ingredients Sales Quantity by Application (2018-2023) & (Tons)
Table 88. North America Upcycled Cosmetic Ingredients Sales Quantity by Application (2024-2029) & (Tons)
Table 89. North America Upcycled Cosmetic Ingredients Sales Quantity by Country (2018-2023) & (Tons)
Table 90. North America Upcycled Cosmetic Ingredients Sales Quantity by Country (2024-2029) & (Tons)
Table 91. North America Upcycled Cosmetic Ingredients Consumption Value by Country (2018-2023) & (USD Million)
Table 92. North America Upcycled Cosmetic Ingredients Consumption Value by Country (2024-2029) & (USD Million)
Table 93. Europe Upcycled Cosmetic Ingredients Sales Quantity by Type (2018-2023) & (Tons)
Table 94. Europe Upcycled Cosmetic Ingredients Sales Quantity by Type (2024-2029) & (Tons)
Table 95. Europe Upcycled Cosmetic Ingredients Sales Quantity by Application (2018-2023) & (Tons)
Table 96. Europe Upcycled Cosmetic Ingredients Sales Quantity by Application (2024-2029) & (Tons)
Table 97. Europe Upcycled Cosmetic Ingredients Sales Quantity by Country (2018-2023) & (Tons)
Table 98. Europe Upcycled Cosmetic Ingredients Sales Quantity by Country (2024-2029) & (Tons)
Table 99. Europe Upcycled Cosmetic Ingredients Consumption Value by Country (2018-2023) & (USD Million)
Table 100. Europe Upcycled Cosmetic Ingredients Consumption Value by Country (2024-2029) & (USD Million)
Table 101. Asia-Pacific Upcycled Cosmetic Ingredients Sales Quantity by Type (2018-2023) & (Tons)
Table 102. Asia-Pacific Upcycled Cosmetic Ingredients Sales Quantity by Type (2024-2029) & (Tons)
Table 103. Asia-Pacific Upcycled Cosmetic Ingredients Sales Quantity by Application (2018-2023) & (Tons)
Table 104. Asia-Pacific Upcycled Cosmetic Ingredients Sales Quantity by Application (2024-2029) & (Tons)
Table 105. Asia-Pacific Upcycled Cosmetic Ingredients Sales Quantity by Region (2018-2023) & (Tons)
Table 106. Asia-Pacific Upcycled Cosmetic Ingredients Sales Quantity by Region (2024-2029) & (Tons)
Table 107. Asia-Pacific Upcycled Cosmetic Ingredients Consumption Value by Region (2018-2023) & (USD Million)
Table 108. Asia-Pacific Upcycled Cosmetic Ingredients Consumption Value by Region (2024-2029) & (USD Million)
Table 109. South America Upcycled Cosmetic Ingredients Sales Quantity by Type (2018-2023) & (Tons)
Table 110. South America Upcycled Cosmetic Ingredients Sales Quantity by Type (2024-2029) & (Tons)
Table 111. South America Upcycled Cosmetic Ingredients Sales Quantity by Application (2018-2023) & (Tons)
Table 112. South America Upcycled Cosmetic Ingredients Sales Quantity by Application (2024-2029) & (Tons)
Table 113. South America Upcycled Cosmetic Ingredients Sales Quantity by Country (2018-2023) & (Tons)
Table 114. South America Upcycled Cosmetic Ingredients Sales Quantity by Country (2024-2029) & (Tons)
Table 115. South America Upcycled Cosmetic Ingredients Consumption Value by Country (2018-2023) & (USD Million)
Table 116. South America Upcycled Cosmetic Ingredients Consumption Value by Country (2024-2029) & (USD Million)
Table 117. Middle East & Africa Upcycled Cosmetic Ingredients Sales Quantity by Type (2018-2023) & (Tons)
Table 118. Middle East & Africa Upcycled Cosmetic Ingredients Sales Quantity by Type (2024-2029) & (Tons)
Table 119. Middle East & Africa Upcycled Cosmetic Ingredients Sales Quantity by Application (2018-2023) & (Tons)
Table 120. Middle East & Africa Upcycled Cosmetic Ingredients Sales Quantity by Application (2024-2029) & (Tons)
Table 121. Middle East & Africa Upcycled Cosmetic Ingredients Sales Quantity by Region (2018-2023) & (Tons)
Table 122. Middle East & Africa Upcycled Cosmetic Ingredients Sales Quantity by Region (2024-2029) & (Tons)
Table 123. Middle East & Africa Upcycled Cosmetic Ingredients Consumption Value by Region (2018-2023) & (USD Million)
Table 124. Middle East & Africa Upcycled Cosmetic Ingredients Consumption Value by Region (2024-2029) & (USD Million)
Table 125. Upcycled Cosmetic Ingredients Raw Material
Table 126. Key Manufacturers of Upcycled Cosmetic Ingredients Raw Materials
Table 127. Upcycled Cosmetic Ingredients Typical Distributors
Table 128. Upcycled Cosmetic Ingredients Typical Customers
List of Figures
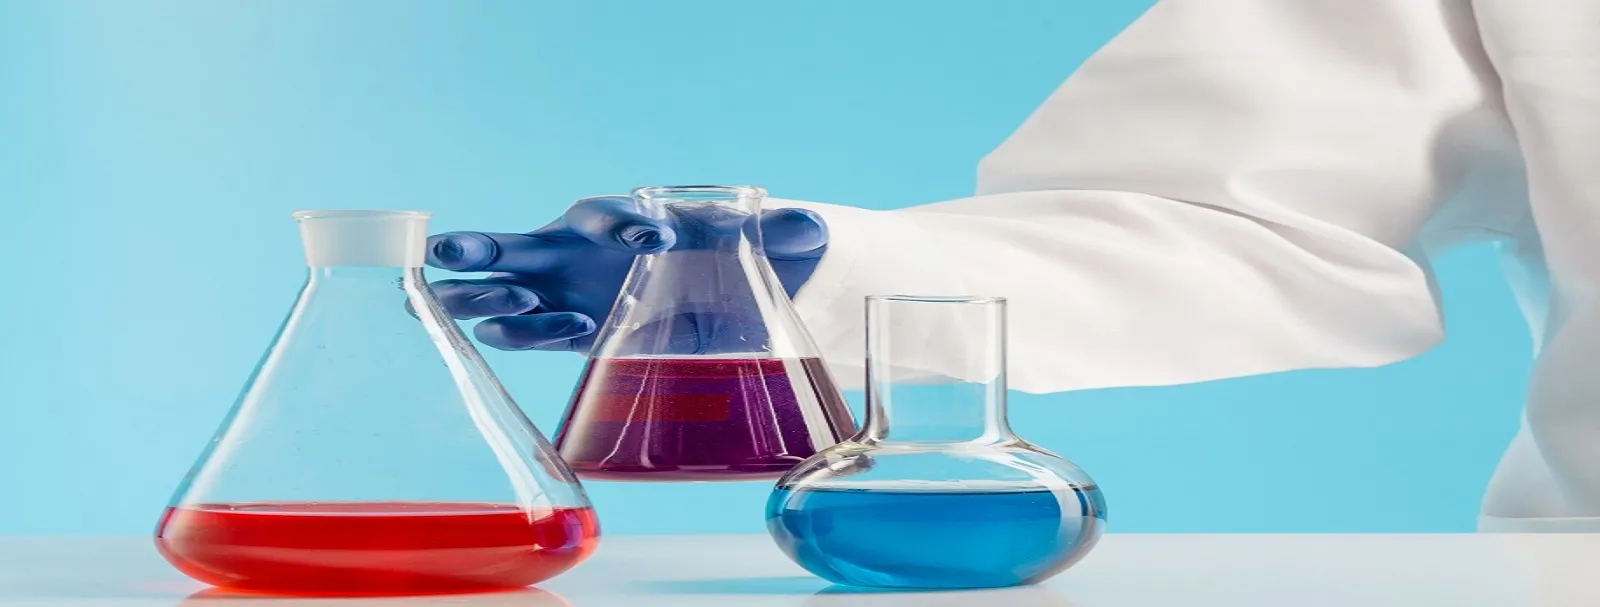
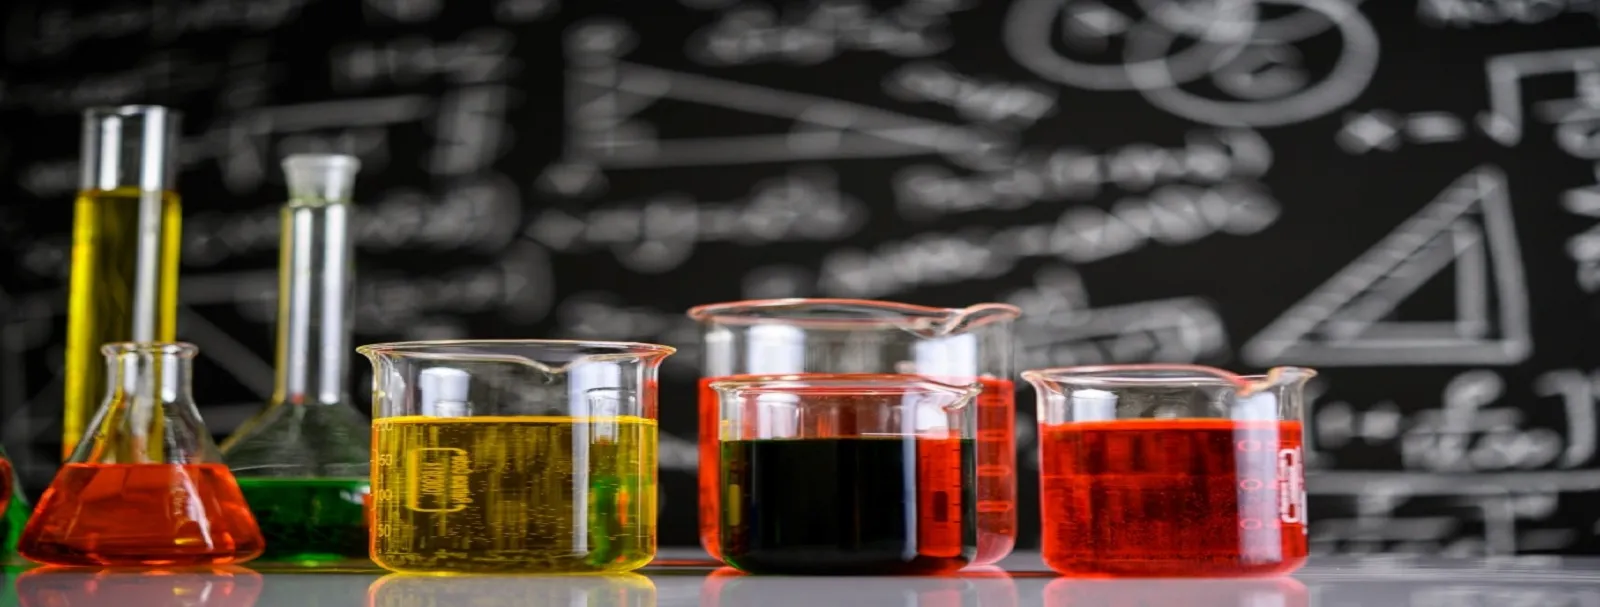
Figure 1. Upcycled Cosmetic Ingredients Picture
Figure 2. Global Upcycled Cosmetic Ingredients Consumption Value by Type, (USD Million), 2018 & 2022 & 2029
Figure 3. Global Upcycled Cosmetic Ingredients Consumption Value Market Share by Type in 2022
Figure 4. Liquid Examples
Figure 5. Powder Examples
Figure 6. Others Examples
Figure 7. Global Upcycled Cosmetic Ingredients Consumption Value by Application, (USD Million), 2018 & 2022 & 2029
Figure 8. Global Upcycled Cosmetic Ingredients Consumption Value Market Share by Application in 2022
Figure 9. Skin Care Examples
Figure 10. Hair Care Examples
Figure 11. Color Cosmetics Examples
Figure 12. Others Examples
Figure 13. Global Upcycled Cosmetic Ingredients Consumption Value, (USD Million): 2018 & 2022 & 2029
Figure 14. Global Upcycled Cosmetic Ingredients Consumption Value and Forecast (2018-2029) & (USD Million)
Figure 15. Global Upcycled Cosmetic Ingredients Sales Quantity (2018-2029) & (Tons)
Figure 16. Global Upcycled Cosmetic Ingredients Average Price (2018-2029) & (US$/Ton)
Figure 17. Global Upcycled Cosmetic Ingredients Sales Quantity Market Share by Manufacturer in 2022
Figure 18. Global Upcycled Cosmetic Ingredients Consumption Value Market Share by Manufacturer in 2022
Figure 19. Producer Shipments of Upcycled Cosmetic Ingredients by Manufacturer Sales Quantity ($MM) and Market Share (%): 2021
Figure 20. Top 3 Upcycled Cosmetic Ingredients Manufacturer (Consumption Value) Market Share in 2022
Figure 21. Top 6 Upcycled Cosmetic Ingredients Manufacturer (Consumption Value) Market Share in 2022
Figure 22. Global Upcycled Cosmetic Ingredients Sales Quantity Market Share by Region (2018-2029)
Figure 23. Global Upcycled Cosmetic Ingredients Consumption Value Market Share by Region (2018-2029)
Figure 24. North America Upcycled Cosmetic Ingredients Consumption Value (2018-2029) & (USD Million)
Figure 25. Europe Upcycled Cosmetic Ingredients Consumption Value (2018-2029) & (USD Million)
Figure 26. Asia-Pacific Upcycled Cosmetic Ingredients Consumption Value (2018-2029) & (USD Million)
Figure 27. South America Upcycled Cosmetic Ingredients Consumption Value (2018-2029) & (USD Million)
Figure 28. Middle East & Africa Upcycled Cosmetic Ingredients Consumption Value (2018-2029) & (USD Million)
Figure 29. Global Upcycled Cosmetic Ingredients Sales Quantity Market Share by Type (2018-2029)
Figure 30. Global Upcycled Cosmetic Ingredients Consumption Value Market Share by Type (2018-2029)
Figure 31. Global Upcycled Cosmetic Ingredients Average Price by Type (2018-2029) & (US$/Ton)
Figure 32. Global Upcycled Cosmetic Ingredients Sales Quantity Market Share by Application (2018-2029)
Figure 33. Global Upcycled Cosmetic Ingredients Consumption Value Market Share by Application (2018-2029)
Figure 34. Global Upcycled Cosmetic Ingredients Average Price by Application (2018-2029) & (US$/Ton)
Figure 35. North America Upcycled Cosmetic Ingredients Sales Quantity Market Share by Type (2018-2029)
Figure 36. North America Upcycled Cosmetic Ingredients Sales Quantity Market Share by Application (2018-2029)
Figure 37. North America Upcycled Cosmetic Ingredients Sales Quantity Market Share by Country (2018-2029)
Figure 38. North America Upcycled Cosmetic Ingredients Consumption Value Market Share by Country (2018-2029)
Figure 39. United States Upcycled Cosmetic Ingredients Consumption Value and Growth Rate (2018-2029) & (USD Million)
Figure 40. Canada Upcycled Cosmetic Ingredients Consumption Value and Growth Rate (2018-2029) & (USD Million)
Figure 41. Mexico Upcycled Cosmetic Ingredients Consumption Value and Growth Rate (2018-2029) & (USD Million)
Figure 42. Europe Upcycled Cosmetic Ingredients Sales Quantity Market Share by Type (2018-2029)
Figure 43. Europe Upcycled Cosmetic Ingredients Sales Quantity Market Share by Application (2018-2029)
Figure 44. Europe Upcycled Cosmetic Ingredients Sales Quantity Market Share by Country (2018-2029)
Figure 45. Europe Upcycled Cosmetic Ingredients Consumption Value Market Share by Country (2018-2029)
Figure 46. Germany Upcycled Cosmetic Ingredients Consumption Value and Growth Rate (2018-2029) & (USD Million)
Figure 47. France Upcycled Cosmetic Ingredients Consumption Value and Growth Rate (2018-2029) & (USD Million)
Figure 48. United Kingdom Upcycled Cosmetic Ingredients Consumption Value and Growth Rate (2018-2029) & (USD Million)
Figure 49. Russia Upcycled Cosmetic Ingredients Consumption Value and Growth Rate (2018-2029) & (USD Million)
Figure 50. Italy Upcycled Cosmetic Ingredients Consumption Value and Growth Rate (2018-2029) & (USD Million)
Figure 51. Asia-Pacific Upcycled Cosmetic Ingredients Sales Quantity Market Share by Type (2018-2029)
Figure 52. Asia-Pacific Upcycled Cosmetic Ingredients Sales Quantity Market Share by Application (2018-2029)
Figure 53. Asia-Pacific Upcycled Cosmetic Ingredients Sales Quantity Market Share by Region (2018-2029)
Figure 54. Asia-Pacific Upcycled Cosmetic Ingredients Consumption Value Market Share by Region (2018-2029)
Figure 55. China Upcycled Cosmetic Ingredients Consumption Value and Growth Rate (2018-2029) & (USD Million)
Figure 56. Japan Upcycled Cosmetic Ingredients Consumption Value and Growth Rate (2018-2029) & (USD Million)
Figure 57. Korea Upcycled Cosmetic Ingredients Consumption Value and Growth Rate (2018-2029) & (USD Million)
Figure 58. India Upcycled Cosmetic Ingredients Consumption Value and Growth Rate (2018-2029) & (USD Million)
Figure 59. Southeast Asia Upcycled Cosmetic Ingredients Consumption Value and Growth Rate (2018-2029) & (USD Million)
Figure 60. Australia Upcycled Cosmetic Ingredients Consumption Value and Growth Rate (2018-2029) & (USD Million)
Figure 61. South America Upcycled Cosmetic Ingredients Sales Quantity Market Share by Type (2018-2029)
Figure 62. South America Upcycled Cosmetic Ingredients Sales Quantity Market Share by Application (2018-2029)
Figure 63. South America Upcycled Cosmetic Ingredients Sales Quantity Market Share by Country (2018-2029)
Figure 64. South America Upcycled Cosmetic Ingredients Consumption Value Market Share by Country (2018-2029)
Figure 65. Brazil Upcycled Cosmetic Ingredients Consumption Value and Growth Rate (2018-2029) & (USD Million)
Figure 66. Argentina Upcycled Cosmetic Ingredients Consumption Value and Growth Rate (2018-2029) & (USD Million)
Figure 67. Middle East & Africa Upcycled Cosmetic Ingredients Sales Quantity Market Share by Type (2018-2029)
Figure 68. Middle East & Africa Upcycled Cosmetic Ingredients Sales Quantity Market Share by Application (2018-2029)
Figure 69. Middle East & Africa Upcycled Cosmetic Ingredients Sales Quantity Market Share by Region (2018-2029)
Figure 70. Middle East & Africa Upcycled Cosmetic Ingredients Consumption Value Market Share by Region (2018-2029)
Figure 71. Turkey Upcycled Cosmetic Ingredients Consumption Value and Growth Rate (2018-2029) & (USD Million)
Figure 72. Egypt Upcycled Cosmetic Ingredients Consumption Value and Growth Rate (2018-2029) & (USD Million)
Figure 73. Saudi Arabia Upcycled Cosmetic Ingredients Consumption Value and Growth Rate (2018-2029) & (USD Million)
Figure 74. South Africa Upcycled Cosmetic Ingredients Consumption Value and Growth Rate (2018-2029) & (USD Million)
Figure 75. Upcycled Cosmetic Ingredients Market Drivers
Figure 76. Upcycled Cosmetic Ingredients Market Restraints
Figure 77. Upcycled Cosmetic Ingredients Market Trends
Figure 78. Porters Five Forces Analysis
Figure 79. Manufacturing Cost Structure Analysis of Upcycled Cosmetic Ingredients in 2022
Figure 80. Manufacturing Process Analysis of Upcycled Cosmetic Ingredients
Figure 81. Upcycled Cosmetic Ingredients Industrial Chain
Figure 82. Sales Quantity Channel: Direct to End-User vs Distributors
Figure 83. Direct Channel Pros & Cons
Figure 84. Indirect Channel Pros & Cons
Figure 85. Methodology
Figure 86. Research Process and Data Source