Market Outlook
The global Sodium Sulfide Market size was valued at USD 987.8 million in 2022 and is forecast to a readjusted size of USD 1405.5 million by 2029 with a CAGR of 5.2% during review period.
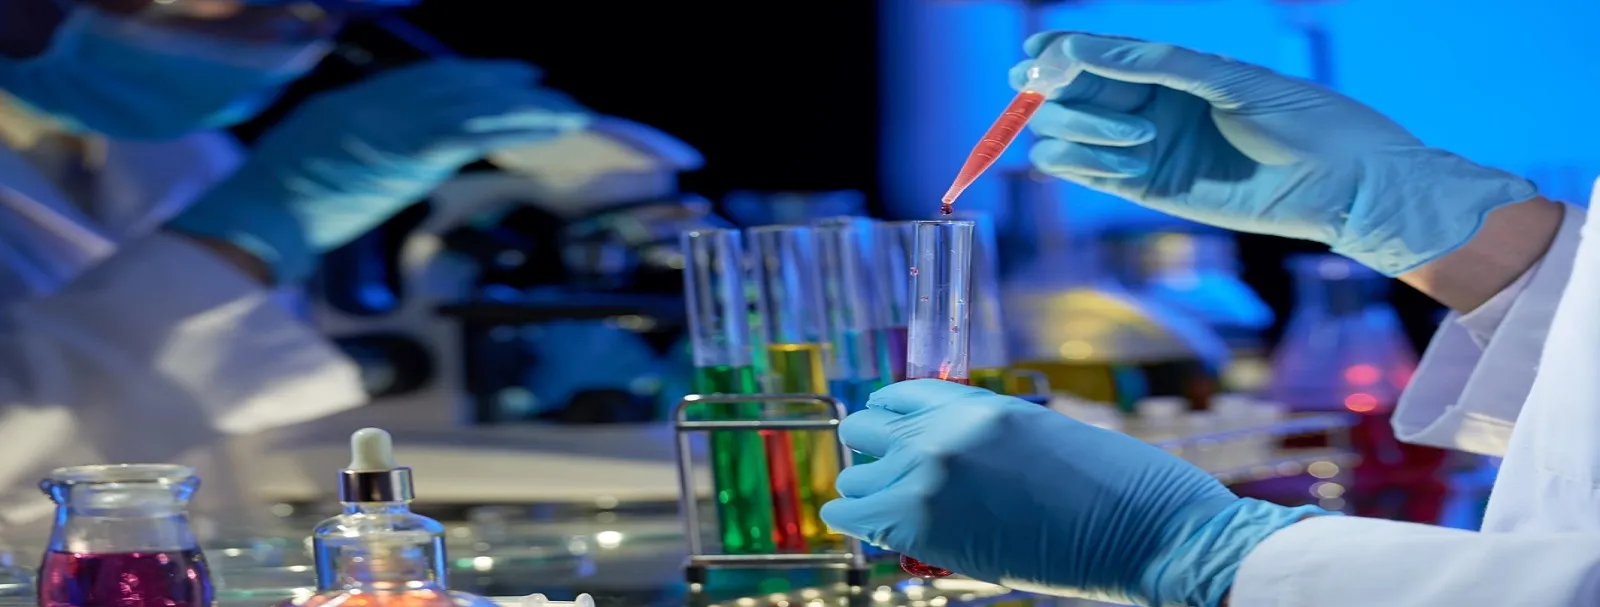
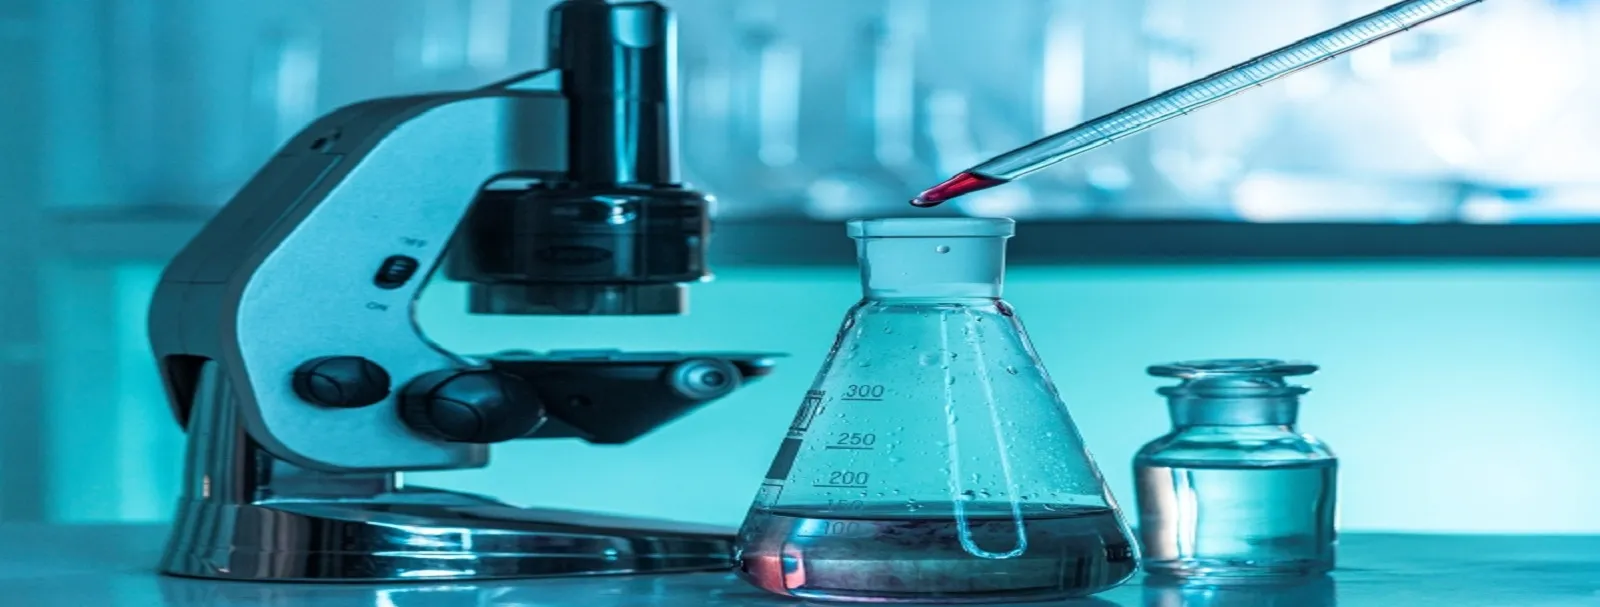
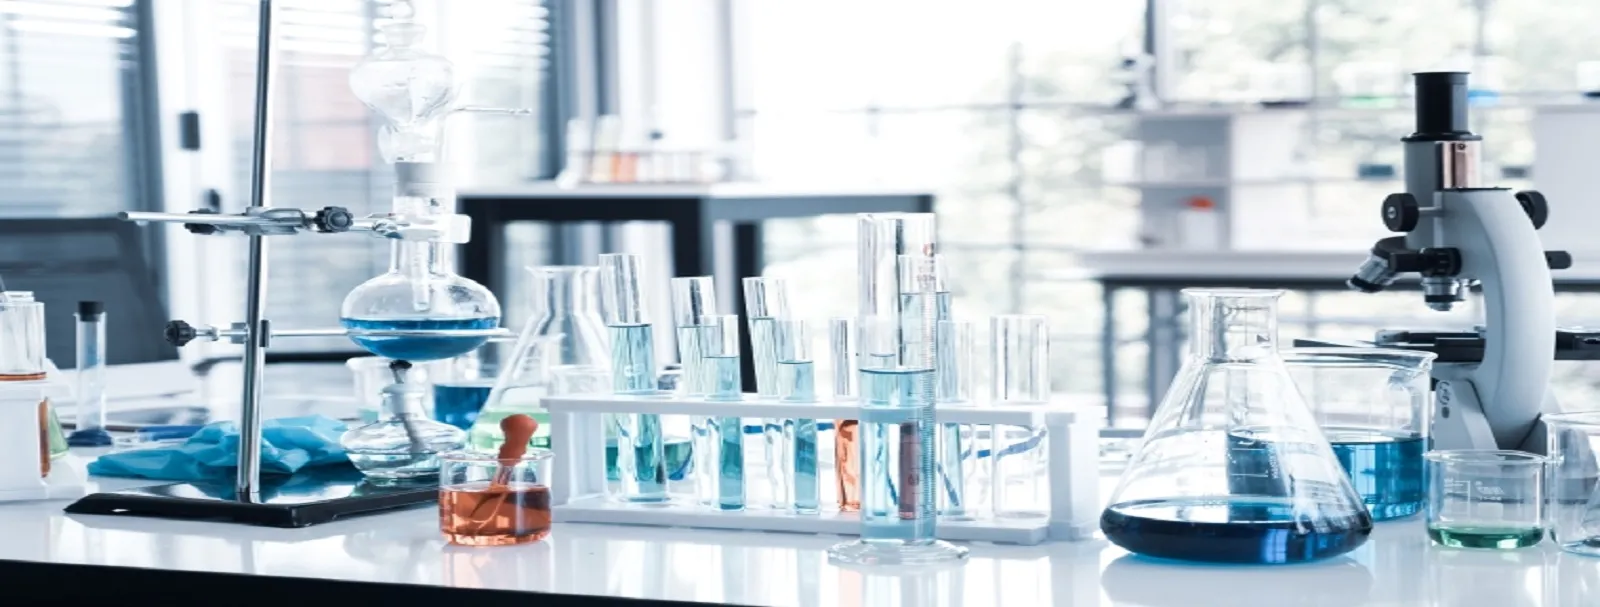
Sodium sulfide is a yellow, solid flake with a sulfurous (rotten egg) smell. It is the name used to refer to the chemical compound Na2S but more commonly its hydrate Na2S.9H2O. Both are colorless water-soluble salts that give strongly alkaline solutions. It is usually obtained by heating sodium sulfate with coal or hydrogen. Sodium sulfide may be used in the making of colors and dyes. It can also be used in the manufacture of other chemicals, metals or in mining (ore processing) and in waste water, soil and process sludge treatment.
Global Sodium Sulfide key players include Solvay, Tessenderlo Group, PPG Industries, ISSC (IRSS), ICS Industriechemikalien Schwefelnatrium, etc.
China is the largest market, with a share about 35%, followed by North America and Europe, having a total share about 20 percent.
In terms of product, Low Ferric Sodium Sulfide is the largest segment, with a share about 85%. And in terms of application, the largest application is Dye Industry, followed by Leather Industry, Metal Smelting Industry, etc.
This report is a detailed and comprehensive analysis for global Sodium Sulfide market. Both quantitative and qualitative analyses are presented by manufacturers, by region & country, by Type and by Application. As the market is constantly changing, this report explores the competition, supply and demand trends, as well as key factors that contribute to its changing demands across many markets. Company profiles and product examples of selected competitors, along with market share estimates of some of the selected leaders for the year 2023, are provided.
Key Features:
Global Sodium Sulfide market size and forecasts, in consumption value ($ Million), sales quantity (K MT), and average selling prices (USD/MT), 2018-2029.
Global Sodium Sulfide market size and forecasts by region and country, in consumption value ($ Million), sales quantity (K MT), and average selling prices (USD/MT), 2018-2029.
Global Sodium Sulfide market size and forecasts, by Type and by Application, in consumption value ($ Million), sales quantity (K MT), and average selling prices (USD/MT), 2018-2029.
Global Sodium Sulfide market shares of main players, shipments in revenue ($ Million), sales quantity (K MT), and ASP (USD/MT), 2018-2023.
The Primary Objectives in This Report Are:
To determine the size of the total market opportunity of global and key countries.
To assess the growth potential for Sodium Sulfide.
To forecast future growth in each product and end-use market.
To assess competitive factors affecting the marketplace.
This report profiles key players in the global Sodium Sulfide market based on the following parameters - company overview, production, value, price, gross margin, product portfolio, geographical presence, and key developments.
This report also provides key insights about market drivers, restraints, opportunities, new product launches or approvals, COVID-19 and Russia-Ukraine War Influence.
Key Market Players
Solvay
Tessenderlo Group
PPG Industries
ISSC (IRSS)
ICS Industriechemikalien Schwefelnatrium
Sankyo Kasei
Novochrom
Rahul Barium Chemicals
Nafine Chemical Industry
Shenhong Chemical
Longfu Group
Yabulai Salt Chem
Jiaxin Chemical
HaMi HongShan Chemistry
Guangxin Chemical
Xinji Chemical Group
Shaanxi Fuhua Chemical
Inner Mongolia Lichuan Chemical
Sichuan Meishan Tianhe Chemical
Xinxing Chem
Segmentation By Type
Low Ferric Sodium Sulfide
Crystal Sodium Sulfide
Anhydrous Sodium Sulfide
Segmentation By Application
Dye Industry
Leather Industry
Metal Smelting Industry
Other
Segmentation By Region
North America (United States, Canada and Mexico)
Europe (Germany, France, United Kingdom, Russia, Italy, and Rest of Europe)
Asia-Pacific (China, Japan, Korea, India, Southeast Asia, and Australia)
South America (Brazil, Argentina, Colombia, and Rest of South America)
Middle East & Africa (Saudi Arabia, UAE, Egypt, South Africa, and Rest of Middle East & Africa)
Chapter 1, to describe Sodium Sulfide product scope, market overview, market estimation caveats and base year.
Chapter 2, to profile the top manufacturers of Sodium Sulfide, with price, sales, revenue and global market share of Sodium Sulfide from 2018 to 2023.
Chapter 3, the Sodium Sulfide competitive situation, sales quantity, revenue and global market share of top manufacturers are analyzed emphatically by landscape contrast.
Chapter 4, the Sodium Sulfide breakdown data are shown at the regional level, to show the sales quantity, consumption value and growth by regions, from 2018 to 2029.
Chapter 5 and 6, to segment the sales by Type and application, with sales market share and growth rate by type, application, from 2018 to 2029.
Chapter 7, 8, 9, 10 and 11, to break the sales data at the country level, with sales quantity, consumption value and market share for key countries in the world, from 2017 to 2022.and Sodium Sulfide market forecast, by regions, type and application, with sales and revenue, from 2024 to 2029.
Chapter 12, market dynamics, drivers, restraints, trends, Porters Five Forces analysis, and Influence of COVID-19 and Russia-Ukraine War.
Chapter 13, the key raw materials and key suppliers, and industry chain of Sodium Sulfide.
Chapter 14 and 15, to describe Sodium Sulfide sales channel, distributors, customers, research findings and conclusion.
1 Market Overview
1.1 Product Overview and Scope of Sodium Sulfide
1.2 Market Estimation Caveats and Base Year
1.3 Market Analysis by Type
1.3.1 Overview: Global Sodium Sulfide Consumption Value by Type: 2018 Versus 2022 Versus 2029
1.3.2 Low Ferric Sodium Sulfide
1.3.3 Crystal Sodium Sulfide
1.3.4 Anhydrous Sodium Sulfide
1.4 Market Analysis by Application
1.4.1 Overview: Global Sodium Sulfide Consumption Value by Application: 2018 Versus 2022 Versus 2029
1.4.2 Dye Industry
1.4.3 Leather Industry
1.4.4 Metal Smelting Industry
1.4.5 Other
1.5 Global Sodium Sulfide Market Size & Forecast
1.5.1 Global Sodium Sulfide Consumption Value (2018 & 2022 & 2029)
1.5.2 Global Sodium Sulfide Sales Quantity (2018-2029)
1.5.3 Global Sodium Sulfide Average Price (2018-2029)
2 Manufacturers Profiles
2.1 Solvay
2.1.1 Solvay Details
2.1.2 Solvay Major Business
2.1.3 Solvay Sodium Sulfide Product and Services
2.1.4 Solvay Sodium Sulfide Sales Quantity, Average Price, Revenue, Gross Margin and Market Share (2018-2023)
2.1.5 Solvay Recent Developments/Updates
2.2 Tessenderlo Group
2.2.1 Tessenderlo Group Details
2.2.2 Tessenderlo Group Major Business
2.2.3 Tessenderlo Group Sodium Sulfide Product and Services
2.2.4 Tessenderlo Group Sodium Sulfide Sales Quantity, Average Price, Revenue, Gross Margin and Market Share (2018-2023)
2.2.5 Tessenderlo Group Recent Developments/Updates
2.3 PPG Industries
2.3.1 PPG Industries Details
2.3.2 PPG Industries Major Business
2.3.3 PPG Industries Sodium Sulfide Product and Services
2.3.4 PPG Industries Sodium Sulfide Sales Quantity, Average Price, Revenue, Gross Margin and Market Share (2018-2023)
2.3.5 PPG Industries Recent Developments/Updates
2.4 ISSC (IRSS)
2.4.1 ISSC (IRSS) Details
2.4.2 ISSC (IRSS) Major Business
2.4.3 ISSC (IRSS) Sodium Sulfide Product and Services
2.4.4 ISSC (IRSS) Sodium Sulfide Sales Quantity, Average Price, Revenue, Gross Margin and Market Share (2018-2023)
2.4.5 ISSC (IRSS) Recent Developments/Updates
2.5 ICS Industriechemikalien Schwefelnatrium
2.5.1 ICS Industriechemikalien Schwefelnatrium Details
2.5.2 ICS Industriechemikalien Schwefelnatrium Major Business
2.5.3 ICS Industriechemikalien Schwefelnatrium Sodium Sulfide Product and Services
2.5.4 ICS Industriechemikalien Schwefelnatrium Sodium Sulfide Sales Quantity, Average Price, Revenue, Gross Margin and Market Share (2018-2023)
2.5.5 ICS Industriechemikalien Schwefelnatrium Recent Developments/Updates
2.6 Sankyo Kasei
2.6.1 Sankyo Kasei Details
2.6.2 Sankyo Kasei Major Business
2.6.3 Sankyo Kasei Sodium Sulfide Product and Services
2.6.4 Sankyo Kasei Sodium Sulfide Sales Quantity, Average Price, Revenue, Gross Margin and Market Share (2018-2023)
2.6.5 Sankyo Kasei Recent Developments/Updates
2.7 Novochrom
2.7.1 Novochrom Details
2.7.2 Novochrom Major Business
2.7.3 Novochrom Sodium Sulfide Product and Services
2.7.4 Novochrom Sodium Sulfide Sales Quantity, Average Price, Revenue, Gross Margin and Market Share (2018-2023)
2.7.5 Novochrom Recent Developments/Updates
2.8 Rahul Barium Chemicals
2.8.1 Rahul Barium Chemicals Details
2.8.2 Rahul Barium Chemicals Major Business
2.8.3 Rahul Barium Chemicals Sodium Sulfide Product and Services
2.8.4 Rahul Barium Chemicals Sodium Sulfide Sales Quantity, Average Price, Revenue, Gross Margin and Market Share (2018-2023)
2.8.5 Rahul Barium Chemicals Recent Developments/Updates
2.9 Nafine Chemical Industry
2.9.1 Nafine Chemical Industry Details
2.9.2 Nafine Chemical Industry Major Business
2.9.3 Nafine Chemical Industry Sodium Sulfide Product and Services
2.9.4 Nafine Chemical Industry Sodium Sulfide Sales Quantity, Average Price, Revenue, Gross Margin and Market Share (2018-2023)
2.9.5 Nafine Chemical Industry Recent Developments/Updates
2.10 Shenhong Chemical
2.10.1 Shenhong Chemical Details
2.10.2 Shenhong Chemical Major Business
2.10.3 Shenhong Chemical Sodium Sulfide Product and Services
2.10.4 Shenhong Chemical Sodium Sulfide Sales Quantity, Average Price, Revenue, Gross Margin and Market Share (2018-2023)
2.10.5 Shenhong Chemical Recent Developments/Updates
2.11 Longfu Group
2.11.1 Longfu Group Details
2.11.2 Longfu Group Major Business
2.11.3 Longfu Group Sodium Sulfide Product and Services
2.11.4 Longfu Group Sodium Sulfide Sales Quantity, Average Price, Revenue, Gross Margin and Market Share (2018-2023)
2.11.5 Longfu Group Recent Developments/Updates
2.12 Yabulai Salt Chem
2.12.1 Yabulai Salt Chem Details
2.12.2 Yabulai Salt Chem Major Business
2.12.3 Yabulai Salt Chem Sodium Sulfide Product and Services
2.12.4 Yabulai Salt Chem Sodium Sulfide Sales Quantity, Average Price, Revenue, Gross Margin and Market Share (2018-2023)
2.12.5 Yabulai Salt Chem Recent Developments/Updates
2.13 Jiaxin Chemical
2.13.1 Jiaxin Chemical Details
2.13.2 Jiaxin Chemical Major Business
2.13.3 Jiaxin Chemical Sodium Sulfide Product and Services
2.13.4 Jiaxin Chemical Sodium Sulfide Sales Quantity, Average Price, Revenue, Gross Margin and Market Share (2018-2023)
2.13.5 Jiaxin Chemical Recent Developments/Updates
2.14 HaMi HongShan Chemistry
2.14.1 HaMi HongShan Chemistry Details
2.14.2 HaMi HongShan Chemistry Major Business
2.14.3 HaMi HongShan Chemistry Sodium Sulfide Product and Services
2.14.4 HaMi HongShan Chemistry Sodium Sulfide Sales Quantity, Average Price, Revenue, Gross Margin and Market Share (2018-2023)
2.14.5 HaMi HongShan Chemistry Recent Developments/Updates
2.15 Guangxin Chemical
2.15.1 Guangxin Chemical Details
2.15.2 Guangxin Chemical Major Business
2.15.3 Guangxin Chemical Sodium Sulfide Product and Services
2.15.4 Guangxin Chemical Sodium Sulfide Sales Quantity, Average Price, Revenue, Gross Margin and Market Share (2018-2023)
2.15.5 Guangxin Chemical Recent Developments/Updates
2.16 Xinji Chemical Group
2.16.1 Xinji Chemical Group Details
2.16.2 Xinji Chemical Group Major Business
2.16.3 Xinji Chemical Group Sodium Sulfide Product and Services
2.16.4 Xinji Chemical Group Sodium Sulfide Sales Quantity, Average Price, Revenue, Gross Margin and Market Share (2018-2023)
2.16.5 Xinji Chemical Group Recent Developments/Updates
2.17 Shaanxi Fuhua Chemical
2.17.1 Shaanxi Fuhua Chemical Details
2.17.2 Shaanxi Fuhua Chemical Major Business
2.17.3 Shaanxi Fuhua Chemical Sodium Sulfide Product and Services
2.17.4 Shaanxi Fuhua Chemical Sodium Sulfide Sales Quantity, Average Price, Revenue, Gross Margin and Market Share (2018-2023)
2.17.5 Shaanxi Fuhua Chemical Recent Developments/Updates
2.18 Inner Mongolia Lichuan Chemical
2.18.1 Inner Mongolia Lichuan Chemical Details
2.18.2 Inner Mongolia Lichuan Chemical Major Business
2.18.3 Inner Mongolia Lichuan Chemical Sodium Sulfide Product and Services
2.18.4 Inner Mongolia Lichuan Chemical Sodium Sulfide Sales Quantity, Average Price, Revenue, Gross Margin and Market Share (2018-2023)
2.18.5 Inner Mongolia Lichuan Chemical Recent Developments/Updates
2.19 Sichuan Meishan Tianhe Chemical
2.19.1 Sichuan Meishan Tianhe Chemical Details
2.19.2 Sichuan Meishan Tianhe Chemical Major Business
2.19.3 Sichuan Meishan Tianhe Chemical Sodium Sulfide Product and Services
2.19.4 Sichuan Meishan Tianhe Chemical Sodium Sulfide Sales Quantity, Average Price, Revenue, Gross Margin and Market Share (2018-2023)
2.19.5 Sichuan Meishan Tianhe Chemical Recent Developments/Updates
2.20 Xinxing Chem
2.20.1 Xinxing Chem Details
2.20.2 Xinxing Chem Major Business
2.20.3 Xinxing Chem Sodium Sulfide Product and Services
2.20.4 Xinxing Chem Sodium Sulfide Sales Quantity, Average Price, Revenue, Gross Margin and Market Share (2018-2023)
2.20.5 Xinxing Chem Recent Developments/Updates
3 Competitive Environment: Sodium Sulfide by Manufacturer
3.1 Global Sodium Sulfide Sales Quantity by Manufacturer (2018-2023)
3.2 Global Sodium Sulfide Revenue by Manufacturer (2018-2023)
3.3 Global Sodium Sulfide Average Price by Manufacturer (2018-2023)
3.4 Market Share Analysis (2022)
3.4.1 Producer Shipments of Sodium Sulfide by Manufacturer Revenue ($MM) and Market Share (%): 2022
3.4.2 Top 3 Sodium Sulfide Manufacturer Market Share in 2022
3.4.2 Top 6 Sodium Sulfide Manufacturer Market Share in 2022
3.5 Sodium Sulfide Market: Overall Company Footprint Analysis
3.5.1 Sodium Sulfide Market: Region Footprint
3.5.2 Sodium Sulfide Market: Company Product Type Footprint
3.5.3 Sodium Sulfide Market: Company Product Application Footprint
3.6 New Market Entrants and Barriers to Market Entry
3.7 Mergers, Acquisition, Agreements, and Collaborations
4 Consumption Analysis by Region
4.1 Global Sodium Sulfide Market Size by Region
4.1.1 Global Sodium Sulfide Sales Quantity by Region (2018-2029)
4.1.2 Global Sodium Sulfide Consumption Value by Region (2018-2029)
4.1.3 Global Sodium Sulfide Average Price by Region (2018-2029)
4.2 North America Sodium Sulfide Consumption Value (2018-2029)
4.3 Europe Sodium Sulfide Consumption Value (2018-2029)
4.4 Asia-Pacific Sodium Sulfide Consumption Value (2018-2029)
4.5 South America Sodium Sulfide Consumption Value (2018-2029)
4.6 Middle East and Africa Sodium Sulfide Consumption Value (2018-2029)
5 Market Segment by Type
5.1 Global Sodium Sulfide Sales Quantity by Type (2018-2029)
5.2 Global Sodium Sulfide Consumption Value by Type (2018-2029)
5.3 Global Sodium Sulfide Average Price by Type (2018-2029)
6 Market Segment by Application
6.1 Global Sodium Sulfide Sales Quantity by Application (2018-2029)
6.2 Global Sodium Sulfide Consumption Value by Application (2018-2029)
6.3 Global Sodium Sulfide Average Price by Application (2018-2029)
7 North America
7.1 North America Sodium Sulfide Sales Quantity by Type (2018-2029)
7.2 North America Sodium Sulfide Sales Quantity by Application (2018-2029)
7.3 North America Sodium Sulfide Market Size by Country
7.3.1 North America Sodium Sulfide Sales Quantity by Country (2018-2029)
7.3.2 North America Sodium Sulfide Consumption Value by Country (2018-2029)
7.3.3 United States Market Size and Forecast (2018-2029)
7.3.4 Canada Market Size and Forecast (2018-2029)
7.3.5 Mexico Market Size and Forecast (2018-2029)
8 Europe
8.1 Europe Sodium Sulfide Sales Quantity by Type (2018-2029)
8.2 Europe Sodium Sulfide Sales Quantity by Application (2018-2029)
8.3 Europe Sodium Sulfide Market Size by Country
8.3.1 Europe Sodium Sulfide Sales Quantity by Country (2018-2029)
8.3.2 Europe Sodium Sulfide Consumption Value by Country (2018-2029)
8.3.3 Germany Market Size and Forecast (2018-2029)
8.3.4 France Market Size and Forecast (2018-2029)
8.3.5 United Kingdom Market Size and Forecast (2018-2029)
8.3.6 Russia Market Size and Forecast (2018-2029)
8.3.7 Italy Market Size and Forecast (2018-2029)
9 Asia-Pacific
9.1 Asia-Pacific Sodium Sulfide Sales Quantity by Type (2018-2029)
9.2 Asia-Pacific Sodium Sulfide Sales Quantity by Application (2018-2029)
9.3 Asia-Pacific Sodium Sulfide Market Size by Region
9.3.1 Asia-Pacific Sodium Sulfide Sales Quantity by Region (2018-2029)
9.3.2 Asia-Pacific Sodium Sulfide Consumption Value by Region (2018-2029)
9.3.3 China Market Size and Forecast (2018-2029)
9.3.4 Japan Market Size and Forecast (2018-2029)
9.3.5 Korea Market Size and Forecast (2018-2029)
9.3.6 India Market Size and Forecast (2018-2029)
9.3.7 Southeast Asia Market Size and Forecast (2018-2029)
9.3.8 Australia Market Size and Forecast (2018-2029)
10 South America
10.1 South America Sodium Sulfide Sales Quantity by Type (2018-2029)
10.2 South America Sodium Sulfide Sales Quantity by Application (2018-2029)
10.3 South America Sodium Sulfide Market Size by Country
10.3.1 South America Sodium Sulfide Sales Quantity by Country (2018-2029)
10.3.2 South America Sodium Sulfide Consumption Value by Country (2018-2029)
10.3.3 Brazil Market Size and Forecast (2018-2029)
10.3.4 Argentina Market Size and Forecast (2018-2029)
11 Middle East & Africa
11.1 Middle East & Africa Sodium Sulfide Sales Quantity by Type (2018-2029)
11.2 Middle East & Africa Sodium Sulfide Sales Quantity by Application (2018-2029)
11.3 Middle East & Africa Sodium Sulfide Market Size by Country
11.3.1 Middle East & Africa Sodium Sulfide Sales Quantity by Country (2018-2029)
11.3.2 Middle East & Africa Sodium Sulfide Consumption Value by Country (2018-2029)
11.3.3 Turkey Market Size and Forecast (2018-2029)
11.3.4 Egypt Market Size and Forecast (2018-2029)
11.3.5 Saudi Arabia Market Size and Forecast (2018-2029)
11.3.6 South Africa Market Size and Forecast (2018-2029)
12 Market Dynamics
12.1 Sodium Sulfide Market Drivers
12.2 Sodium Sulfide Market Restraints
12.3 Sodium Sulfide Trends Analysis
12.4 Porters Five Forces Analysis
12.4.1 Threat of New Entrants
12.4.2 Bargaining Power of Suppliers
12.4.3 Bargaining Power of Buyers
12.4.4 Threat of Substitutes
12.4.5 Competitive Rivalry
12.5 Influence of COVID-19 and Russia-Ukraine War
12.5.1 Influence of COVID-19
12.5.2 Influence of Russia-Ukraine War
13 Raw Material and Industry Chain
13.1 Raw Material of Sodium Sulfide and Key Manufacturers
13.2 Manufacturing Costs Percentage of Sodium Sulfide
13.3 Sodium Sulfide Production Process
13.4 Sodium Sulfide Industrial Chain
14 Shipments by Distribution Channel
14.1 Sales Channel
14.1.1 Direct to End-User
14.1.2 Distributors
14.2 Sodium Sulfide Typical Distributors
14.3 Sodium Sulfide Typical Customers
15 Research Findings and Conclusion
16 Appendix
16.1 Methodology
16.2 Research Process and Data Source
16.3 Disclaimer
List of Tables
Table 1. Global Sodium Sulfide Consumption Value by Type, (USD Million), 2018 & 2022 & 2029
Table 2. Global Sodium Sulfide Consumption Value by Application, (USD Million), 2018 & 2022 & 2029
Table 3. Solvay Basic Information, Manufacturing Base and Competitors
Table 4. Solvay Major Business
Table 5. Solvay Sodium Sulfide Product and Services
Table 6. Solvay Sodium Sulfide Sales Quantity (K MT), Average Price (USD/MT), Revenue (USD Million), Gross Margin and Market Share (2018-2023)
Table 7. Solvay Recent Developments/Updates
Table 8. Tessenderlo Group Basic Information, Manufacturing Base and Competitors
Table 9. Tessenderlo Group Major Business
Table 10. Tessenderlo Group Sodium Sulfide Product and Services
Table 11. Tessenderlo Group Sodium Sulfide Sales Quantity (K MT), Average Price (USD/MT), Revenue (USD Million), Gross Margin and Market Share (2018-2023)
Table 12. Tessenderlo Group Recent Developments/Updates
Table 13. PPG Industries Basic Information, Manufacturing Base and Competitors
Table 14. PPG Industries Major Business
Table 15. PPG Industries Sodium Sulfide Product and Services
Table 16. PPG Industries Sodium Sulfide Sales Quantity (K MT), Average Price (USD/MT), Revenue (USD Million), Gross Margin and Market Share (2018-2023)
Table 17. PPG Industries Recent Developments/Updates
Table 18. ISSC (IRSS) Basic Information, Manufacturing Base and Competitors
Table 19. ISSC (IRSS) Major Business
Table 20. ISSC (IRSS) Sodium Sulfide Product and Services
Table 21. ISSC (IRSS) Sodium Sulfide Sales Quantity (K MT), Average Price (USD/MT), Revenue (USD Million), Gross Margin and Market Share (2018-2023)
Table 22. ISSC (IRSS) Recent Developments/Updates
Table 23. ICS Industriechemikalien Schwefelnatrium Basic Information, Manufacturing Base and Competitors
Table 24. ICS Industriechemikalien Schwefelnatrium Major Business
Table 25. ICS Industriechemikalien Schwefelnatrium Sodium Sulfide Product and Services
Table 26. ICS Industriechemikalien Schwefelnatrium Sodium Sulfide Sales Quantity (K MT), Average Price (USD/MT), Revenue (USD Million), Gross Margin and Market Share (2018-2023)
Table 27. ICS Industriechemikalien Schwefelnatrium Recent Developments/Updates
Table 28. Sankyo Kasei Basic Information, Manufacturing Base and Competitors
Table 29. Sankyo Kasei Major Business
Table 30. Sankyo Kasei Sodium Sulfide Product and Services
Table 31. Sankyo Kasei Sodium Sulfide Sales Quantity (K MT), Average Price (USD/MT), Revenue (USD Million), Gross Margin and Market Share (2018-2023)
Table 32. Sankyo Kasei Recent Developments/Updates
Table 33. Novochrom Basic Information, Manufacturing Base and Competitors
Table 34. Novochrom Major Business
Table 35. Novochrom Sodium Sulfide Product and Services
Table 36. Novochrom Sodium Sulfide Sales Quantity (K MT), Average Price (USD/MT), Revenue (USD Million), Gross Margin and Market Share (2018-2023)
Table 37. Novochrom Recent Developments/Updates
Table 38. Rahul Barium Chemicals Basic Information, Manufacturing Base and Competitors
Table 39. Rahul Barium Chemicals Major Business
Table 40. Rahul Barium Chemicals Sodium Sulfide Product and Services
Table 41. Rahul Barium Chemicals Sodium Sulfide Sales Quantity (K MT), Average Price (USD/MT), Revenue (USD Million), Gross Margin and Market Share (2018-2023)
Table 42. Rahul Barium Chemicals Recent Developments/Updates
Table 43. Nafine Chemical Industry Basic Information, Manufacturing Base and Competitors
Table 44. Nafine Chemical Industry Major Business
Table 45. Nafine Chemical Industry Sodium Sulfide Product and Services
Table 46. Nafine Chemical Industry Sodium Sulfide Sales Quantity (K MT), Average Price (USD/MT), Revenue (USD Million), Gross Margin and Market Share (2018-2023)
Table 47. Nafine Chemical Industry Recent Developments/Updates
Table 48. Shenhong Chemical Basic Information, Manufacturing Base and Competitors
Table 49. Shenhong Chemical Major Business
Table 50. Shenhong Chemical Sodium Sulfide Product and Services
Table 51. Shenhong Chemical Sodium Sulfide Sales Quantity (K MT), Average Price (USD/MT), Revenue (USD Million), Gross Margin and Market Share (2018-2023)
Table 52. Shenhong Chemical Recent Developments/Updates
Table 53. Longfu Group Basic Information, Manufacturing Base and Competitors
Table 54. Longfu Group Major Business
Table 55. Longfu Group Sodium Sulfide Product and Services
Table 56. Longfu Group Sodium Sulfide Sales Quantity (K MT), Average Price (USD/MT), Revenue (USD Million), Gross Margin and Market Share (2018-2023)
Table 57. Longfu Group Recent Developments/Updates
Table 58. Yabulai Salt Chem Basic Information, Manufacturing Base and Competitors
Table 59. Yabulai Salt Chem Major Business
Table 60. Yabulai Salt Chem Sodium Sulfide Product and Services
Table 61. Yabulai Salt Chem Sodium Sulfide Sales Quantity (K MT), Average Price (USD/MT), Revenue (USD Million), Gross Margin and Market Share (2018-2023)
Table 62. Yabulai Salt Chem Recent Developments/Updates
Table 63. Jiaxin Chemical Basic Information, Manufacturing Base and Competitors
Table 64. Jiaxin Chemical Major Business
Table 65. Jiaxin Chemical Sodium Sulfide Product and Services
Table 66. Jiaxin Chemical Sodium Sulfide Sales Quantity (K MT), Average Price (USD/MT), Revenue (USD Million), Gross Margin and Market Share (2018-2023)
Table 67. Jiaxin Chemical Recent Developments/Updates
Table 68. HaMi HongShan Chemistry Basic Information, Manufacturing Base and Competitors
Table 69. HaMi HongShan Chemistry Major Business
Table 70. HaMi HongShan Chemistry Sodium Sulfide Product and Services
Table 71. HaMi HongShan Chemistry Sodium Sulfide Sales Quantity (K MT), Average Price (USD/MT), Revenue (USD Million), Gross Margin and Market Share (2018-2023)
Table 72. HaMi HongShan Chemistry Recent Developments/Updates
Table 73. Guangxin Chemical Basic Information, Manufacturing Base and Competitors
Table 74. Guangxin Chemical Major Business
Table 75. Guangxin Chemical Sodium Sulfide Product and Services
Table 76. Guangxin Chemical Sodium Sulfide Sales Quantity (K MT), Average Price (USD/MT), Revenue (USD Million), Gross Margin and Market Share (2018-2023)
Table 77. Guangxin Chemical Recent Developments/Updates
Table 78. Xinji Chemical Group Basic Information, Manufacturing Base and Competitors
Table 79. Xinji Chemical Group Major Business
Table 80. Xinji Chemical Group Sodium Sulfide Product and Services
Table 81. Xinji Chemical Group Sodium Sulfide Sales Quantity (K MT), Average Price (USD/MT), Revenue (USD Million), Gross Margin and Market Share (2018-2023)
Table 82. Xinji Chemical Group Recent Developments/Updates
Table 83. Shaanxi Fuhua Chemical Basic Information, Manufacturing Base and Competitors
Table 84. Shaanxi Fuhua Chemical Major Business
Table 85. Shaanxi Fuhua Chemical Sodium Sulfide Product and Services
Table 86. Shaanxi Fuhua Chemical Sodium Sulfide Sales Quantity (K MT), Average Price (USD/MT), Revenue (USD Million), Gross Margin and Market Share (2018-2023)
Table 87. Shaanxi Fuhua Chemical Recent Developments/Updates
Table 88. Inner Mongolia Lichuan Chemical Basic Information, Manufacturing Base and Competitors
Table 89. Inner Mongolia Lichuan Chemical Major Business
Table 90. Inner Mongolia Lichuan Chemical Sodium Sulfide Product and Services
Table 91. Inner Mongolia Lichuan Chemical Sodium Sulfide Sales Quantity (K MT), Average Price (USD/MT), Revenue (USD Million), Gross Margin and Market Share (2018-2023)
Table 92. Inner Mongolia Lichuan Chemical Recent Developments/Updates
Table 93. Sichuan Meishan Tianhe Chemical Basic Information, Manufacturing Base and Competitors
Table 94. Sichuan Meishan Tianhe Chemical Major Business
Table 95. Sichuan Meishan Tianhe Chemical Sodium Sulfide Product and Services
Table 96. Sichuan Meishan Tianhe Chemical Sodium Sulfide Sales Quantity (K MT), Average Price (USD/MT), Revenue (USD Million), Gross Margin and Market Share (2018-2023)
Table 97. Sichuan Meishan Tianhe Chemical Recent Developments/Updates
Table 98. Xinxing Chem Basic Information, Manufacturing Base and Competitors
Table 99. Xinxing Chem Major Business
Table 100. Xinxing Chem Sodium Sulfide Product and Services
Table 101. Xinxing Chem Sodium Sulfide Sales Quantity (K MT), Average Price (USD/MT), Revenue (USD Million), Gross Margin and Market Share (2018-2023)
Table 102. Xinxing Chem Recent Developments/Updates
Table 103. Global Sodium Sulfide Sales Quantity by Manufacturer (2018-2023) & (K MT)
Table 104. Global Sodium Sulfide Revenue by Manufacturer (2018-2023) & (USD Million)
Table 105. Global Sodium Sulfide Average Price by Manufacturer (2018-2023) & (USD/MT)
Table 106. Market Position of Manufacturers in Sodium Sulfide, (Tier 1, Tier 2, and Tier 3), Based on Consumption Value in 2022
Table 107. Head Office and Sodium Sulfide Production Site of Key Manufacturer
Table 108. Sodium Sulfide Market: Company Product Type Footprint
Table 109. Sodium Sulfide Market: Company Product Application Footprint
Table 110. Sodium Sulfide New Market Entrants and Barriers to Market Entry
Table 111. Sodium Sulfide Mergers, Acquisition, Agreements, and Collaborations
Table 112. Global Sodium Sulfide Sales Quantity by Region (2018-2023) & (K MT)
Table 113. Global Sodium Sulfide Sales Quantity by Region (2024-2029) & (K MT)
Table 114. Global Sodium Sulfide Consumption Value by Region (2018-2023) & (USD Million)
Table 115. Global Sodium Sulfide Consumption Value by Region (2024-2029) & (USD Million)
Table 116. Global Sodium Sulfide Average Price by Region (2018-2023) & (USD/MT)
Table 117. Global Sodium Sulfide Average Price by Region (2024-2029) & (USD/MT)
Table 118. Global Sodium Sulfide Sales Quantity by Type (2018-2023) & (K MT)
Table 119. Global Sodium Sulfide Sales Quantity by Type (2024-2029) & (K MT)
Table 120. Global Sodium Sulfide Consumption Value by Type (2018-2023) & (USD Million)
Table 121. Global Sodium Sulfide Consumption Value by Type (2024-2029) & (USD Million)
Table 122. Global Sodium Sulfide Average Price by Type (2018-2023) & (USD/MT)
Table 123. Global Sodium Sulfide Average Price by Type (2024-2029) & (USD/MT)
Table 124. Global Sodium Sulfide Sales Quantity by Application (2018-2023) & (K MT)
Table 125. Global Sodium Sulfide Sales Quantity by Application (2024-2029) & (K MT)
Table 126. Global Sodium Sulfide Consumption Value by Application (2018-2023) & (USD Million)
Table 127. Global Sodium Sulfide Consumption Value by Application (2024-2029) & (USD Million)
Table 128. Global Sodium Sulfide Average Price by Application (2018-2023) & (USD/MT)
Table 129. Global Sodium Sulfide Average Price by Application (2024-2029) & (USD/MT)
Table 130. North America Sodium Sulfide Sales Quantity by Type (2018-2023) & (K MT)
Table 131. North America Sodium Sulfide Sales Quantity by Type (2024-2029) & (K MT)
Table 132. North America Sodium Sulfide Sales Quantity by Application (2018-2023) & (K MT)
Table 133. North America Sodium Sulfide Sales Quantity by Application (2024-2029) & (K MT)
Table 134. North America Sodium Sulfide Sales Quantity by Country (2018-2023) & (K MT)
Table 135. North America Sodium Sulfide Sales Quantity by Country (2024-2029) & (K MT)
Table 136. North America Sodium Sulfide Consumption Value by Country (2018-2023) & (USD Million)
Table 137. North America Sodium Sulfide Consumption Value by Country (2024-2029) & (USD Million)
Table 138. Europe Sodium Sulfide Sales Quantity by Type (2018-2023) & (K MT)
Table 139. Europe Sodium Sulfide Sales Quantity by Type (2024-2029) & (K MT)
Table 140. Europe Sodium Sulfide Sales Quantity by Application (2018-2023) & (K MT)
Table 141. Europe Sodium Sulfide Sales Quantity by Application (2024-2029) & (K MT)
Table 142. Europe Sodium Sulfide Sales Quantity by Country (2018-2023) & (K MT)
Table 143. Europe Sodium Sulfide Sales Quantity by Country (2024-2029) & (K MT)
Table 144. Europe Sodium Sulfide Consumption Value by Country (2018-2023) & (USD Million)
Table 145. Europe Sodium Sulfide Consumption Value by Country (2024-2029) & (USD Million)
Table 146. Asia-Pacific Sodium Sulfide Sales Quantity by Type (2018-2023) & (K MT)
Table 147. Asia-Pacific Sodium Sulfide Sales Quantity by Type (2024-2029) & (K MT)
Table 148. Asia-Pacific Sodium Sulfide Sales Quantity by Application (2018-2023) & (K MT)
Table 149. Asia-Pacific Sodium Sulfide Sales Quantity by Application (2024-2029) & (K MT)
Table 150. Asia-Pacific Sodium Sulfide Sales Quantity by Region (2018-2023) & (K MT)
Table 151. Asia-Pacific Sodium Sulfide Sales Quantity by Region (2024-2029) & (K MT)
Table 152. Asia-Pacific Sodium Sulfide Consumption Value by Region (2018-2023) & (USD Million)
Table 153. Asia-Pacific Sodium Sulfide Consumption Value by Region (2024-2029) & (USD Million)
Table 154. South America Sodium Sulfide Sales Quantity by Type (2018-2023) & (K MT)
Table 155. South America Sodium Sulfide Sales Quantity by Type (2024-2029) & (K MT)
Table 156. South America Sodium Sulfide Sales Quantity by Application (2018-2023) & (K MT)
Table 157. South America Sodium Sulfide Sales Quantity by Application (2024-2029) & (K MT)
Table 158. South America Sodium Sulfide Sales Quantity by Country (2018-2023) & (K MT)
Table 159. South America Sodium Sulfide Sales Quantity by Country (2024-2029) & (K MT)
Table 160. South America Sodium Sulfide Consumption Value by Country (2018-2023) & (USD Million)
Table 161. South America Sodium Sulfide Consumption Value by Country (2024-2029) & (USD Million)
Table 162. Middle East & Africa Sodium Sulfide Sales Quantity by Type (2018-2023) & (K MT)
Table 163. Middle East & Africa Sodium Sulfide Sales Quantity by Type (2024-2029) & (K MT)
Table 164. Middle East & Africa Sodium Sulfide Sales Quantity by Application (2018-2023) & (K MT)
Table 165. Middle East & Africa Sodium Sulfide Sales Quantity by Application (2024-2029) & (K MT)
Table 166. Middle East & Africa Sodium Sulfide Sales Quantity by Region (2018-2023) & (K MT)
Table 167. Middle East & Africa Sodium Sulfide Sales Quantity by Region (2024-2029) & (K MT)
Table 168. Middle East & Africa Sodium Sulfide Consumption Value by Region (2018-2023) & (USD Million)
Table 169. Middle East & Africa Sodium Sulfide Consumption Value by Region (2024-2029) & (USD Million)
Table 170. Sodium Sulfide Raw Material
Table 171. Key Manufacturers of Sodium Sulfide Raw Materials
Table 172. Sodium Sulfide Typical Distributors
Table 173. Sodium Sulfide Typical Customers
List of Figures
Figure 1. Sodium Sulfide Picture
Figure 2. Global Sodium Sulfide Consumption Value by Type, (USD Million), 2018 & 2022 & 2029
Figure 3. Global Sodium Sulfide Consumption Value Market Share by Type in 2022
Figure 4. Low Ferric Sodium Sulfide Examples
Figure 5. Crystal Sodium Sulfide Examples
Figure 6. Anhydrous Sodium Sulfide Examples
Figure 7. Global Sodium Sulfide Consumption Value by Application, (USD Million), 2018 & 2022 & 2029
Figure 8. Global Sodium Sulfide Consumption Value Market Share by Application in 2022
Figure 9. Dye Industry Examples
Figure 10. Leather Industry Examples
Figure 11. Metal Smelting Industry Examples
Figure 12. Other Examples
Figure 13. Global Sodium Sulfide Consumption Value, (USD Million): 2018 & 2022 & 2029
Figure 14. Global Sodium Sulfide Consumption Value and Forecast (2018-2029) & (USD Million)
Figure 15. Global Sodium Sulfide Sales Quantity (2018-2029) & (K MT)
Figure 16. Global Sodium Sulfide Average Price (2018-2029) & (USD/MT)
Figure 17. Global Sodium Sulfide Sales Quantity Market Share by Manufacturer in 2022
Figure 18. Global Sodium Sulfide Consumption Value Market Share by Manufacturer in 2022
Figure 19. Producer Shipments of Sodium Sulfide by Manufacturer Sales Quantity ($MM) and Market Share (%): 2021
Figure 20. Top 3 Sodium Sulfide Manufacturer (Consumption Value) Market Share in 2022
Figure 21. Top 6 Sodium Sulfide Manufacturer (Consumption Value) Market Share in 2022
Figure 22. Global Sodium Sulfide Sales Quantity Market Share by Region (2018-2029)
Figure 23. Global Sodium Sulfide Consumption Value Market Share by Region (2018-2029)
Figure 24. North America Sodium Sulfide Consumption Value (2018-2029) & (USD Million)
Figure 25. Europe Sodium Sulfide Consumption Value (2018-2029) & (USD Million)
Figure 26. Asia-Pacific Sodium Sulfide Consumption Value (2018-2029) & (USD Million)
Figure 27. South America Sodium Sulfide Consumption Value (2018-2029) & (USD Million)
Figure 28. Middle East & Africa Sodium Sulfide Consumption Value (2018-2029) & (USD Million)
Figure 29. Global Sodium Sulfide Sales Quantity Market Share by Type (2018-2029)
Figure 30. Global Sodium Sulfide Consumption Value Market Share by Type (2018-2029)
Figure 31. Global Sodium Sulfide Average Price by Type (2018-2029) & (USD/MT)
Figure 32. Global Sodium Sulfide Sales Quantity Market Share by Application (2018-2029)
Figure 33. Global Sodium Sulfide Consumption Value Market Share by Application (2018-2029)
Figure 34. Global Sodium Sulfide Average Price by Application (2018-2029) & (USD/MT)
Figure 35. North America Sodium Sulfide Sales Quantity Market Share by Type (2018-2029)
Figure 36. North America Sodium Sulfide Sales Quantity Market Share by Application (2018-2029)
Figure 37. North America Sodium Sulfide Sales Quantity Market Share by Country (2018-2029)
Figure 38. North America Sodium Sulfide Consumption Value Market Share by Country (2018-2029)
Figure 39. United States Sodium Sulfide Consumption Value and Growth Rate (2018-2029) & (USD Million)
Figure 40. Canada Sodium Sulfide Consumption Value and Growth Rate (2018-2029) & (USD Million)
Figure 41. Mexico Sodium Sulfide Consumption Value and Growth Rate (2018-2029) & (USD Million)
Figure 42. Europe Sodium Sulfide Sales Quantity Market Share by Type (2018-2029)
Figure 43. Europe Sodium Sulfide Sales Quantity Market Share by Application (2018-2029)
Figure 44. Europe Sodium Sulfide Sales Quantity Market Share by Country (2018-2029)
Figure 45. Europe Sodium Sulfide Consumption Value Market Share by Country (2018-2029)
Figure 46. Germany Sodium Sulfide Consumption Value and Growth Rate (2018-2029) & (USD Million)
Figure 47. France Sodium Sulfide Consumption Value and Growth Rate (2018-2029) & (USD Million)
Figure 48. United Kingdom Sodium Sulfide Consumption Value and Growth Rate (2018-2029) & (USD Million)
Figure 49. Russia Sodium Sulfide Consumption Value and Growth Rate (2018-2029) & (USD Million)
Figure 50. Italy Sodium Sulfide Consumption Value and Growth Rate (2018-2029) & (USD Million)
Figure 51. Asia-Pacific Sodium Sulfide Sales Quantity Market Share by Type (2018-2029)
Figure 52. Asia-Pacific Sodium Sulfide Sales Quantity Market Share by Application (2018-2029)
Figure 53. Asia-Pacific Sodium Sulfide Sales Quantity Market Share by Region (2018-2029)
Figure 54. Asia-Pacific Sodium Sulfide Consumption Value Market Share by Region (2018-2029)
Figure 55. China Sodium Sulfide Consumption Value and Growth Rate (2018-2029) & (USD Million)
Figure 56. Japan Sodium Sulfide Consumption Value and Growth Rate (2018-2029) & (USD Million)
Figure 57. Korea Sodium Sulfide Consumption Value and Growth Rate (2018-2029) & (USD Million)
Figure 58. India Sodium Sulfide Consumption Value and Growth Rate (2018-2029) & (USD Million)
Figure 59. Southeast Asia Sodium Sulfide Consumption Value and Growth Rate (2018-2029) & (USD Million)
Figure 60. Australia Sodium Sulfide Consumption Value and Growth Rate (2018-2029) & (USD Million)
Figure 61. South America Sodium Sulfide Sales Quantity Market Share by Type (2018-2029)
Figure 62. South America Sodium Sulfide Sales Quantity Market Share by Application (2018-2029)
Figure 63. South America Sodium Sulfide Sales Quantity Market Share by Country (2018-2029)
Figure 64. South America Sodium Sulfide Consumption Value Market Share by Country (2018-2029)
Figure 65. Brazil Sodium Sulfide Consumption Value and Growth Rate (2018-2029) & (USD Million)
Figure 66. Argentina Sodium Sulfide Consumption Value and Growth Rate (2018-2029) & (USD Million)
Figure 67. Middle East & Africa Sodium Sulfide Sales Quantity Market Share by Type (2018-2029)
Figure 68. Middle East & Africa Sodium Sulfide Sales Quantity Market Share by Application (2018-2029)
Figure 69. Middle East & Africa Sodium Sulfide Sales Quantity Market Share by Region (2018-2029)
Figure 70. Middle East & Africa Sodium Sulfide Consumption Value Market Share by Region (2018-2029)
Figure 71. Turkey Sodium Sulfide Consumption Value and Growth Rate (2018-2029) & (USD Million)
Figure 72. Egypt Sodium Sulfide Consumption Value and Growth Rate (2018-2029) & (USD Million)
Figure 73. Saudi Arabia Sodium Sulfide Consumption Value and Growth Rate (2018-2029) & (USD Million)
Figure 74. South Africa Sodium Sulfide Consumption Value and Growth Rate (2018-2029) & (USD Million)
Figure 75. Sodium Sulfide Market Drivers
Figure 76. Sodium Sulfide Market Restraints
Figure 77. Sodium Sulfide Market Trends
Figure 78. Porters Five Forces Analysis
Figure 79. Manufacturing Cost Structure Analysis of Sodium Sulfide in 2022
Figure 80. Manufacturing Process Analysis of Sodium Sulfide
Figure 81. Sodium Sulfide Industrial Chain
Figure 82. Sales Quantity Channel: Direct to End-User vs Distributors
Figure 83. Direct Channel Pros & Cons
Figure 84. Indirect Channel Pros & Cons
Figure 85. Methodology
Figure 86. Research Process and Data Source